With the release of version 1.6.0 of the Spotter firmware, real-time estimates of wind speed and direction are available on your Spotter and Dashboard. Here’s how that works.
As wind blows over the surface of the ocean it creates small ripples that grow into larger waves over time. It is not an exaggeration to say that virtually all ocean waves–from choppy storm waves to smooth swells–ultimately originate from the interaction between wind and ocean surface. As a consequence, there is typically a strong correlation between local winds and wave conditions. Harald Sverdrup and Walter Munk* were the first to utilize this correlation to predict the wave height given wind speed using empirical relations. One of the first and most dramatic uses of their methodology was the prediction of wave conditions during D-Day: the Allied invasion of France in WW2. Their procedures were used into the 1970s to forecast wave conditions around the globe, and are still used in modified form to this day for preliminary engineering calculations.
Given wind speed and direction we can estimate the magnitude and direction of the resultant waves. And this suggests that the inverse may also be true: given the wave conditions we can estimate the wind.
Imagine a large weather system (order 100 km) that quickly grows in intensity over a few hours to reach a peak wind. Initially, only small ripples are generated, but as more energy is transferred from the atmosphere into the water the waves grow larger and longer. Such wind-generated waves consist of many different wave components, each with their own period and direction.
To describe this seemingly chaotic motion we typically consider the energy density spectrum of the wave field, which describes how energy is distributed over different frequencies (or wave periods). The spectral peaks identify the dominant frequencies, and the width of the spectrum relates to how irregular (or “choppy”) the surface looks. The area under the spectrum relates to total energy and wave height (more energy implies higher waves). Typically most energy (70%, say) is contained near the spectral peak, and energies quickly drop of as frequency increases (shorter waves). Further, as the waves grow larger the peak of the spectrum moves to lower frequencies due to nonlinear interactions that redistribute energy within the spectrum.

With an increasingly energetic sea, wave breaking - referred to as whitecapping - becomes increasingly more frequent and eventually the energy transfer from wind to waves is balanced by energy dissipation from whitecapping. In this situation the wavefield is fully developed and in balance with the local forcing winds. The limiting wave height and wave period for a given wind speed associated with fully developed conditions were first estimated during pioneering experiments by Willard Pierson and Lionel Moskowitz (1964). Not only did they discover that wave height achieves a maximum, they also found that the shape of the spectrum stabilizes due to the interplay between generation by wind, dissipation by breaking, and nonlinear interactions. This shape became known as the Pierson and Moskowitz spectrum.
Whether equilibrium truly exists, especially at high wind speeds, is still a matter of scientific debate, but the basic notion -- that wave conditions depend on wind speed -- is well established. More specifically, Owen Phillips argued that in the tail of the spectrum (high frequencies) a balance is quickly formed between the three dominant processes:
Phillips posed that all three processes scale with the frequency (as f-4) and predicted that the spectral shape should have the form:
Where C is a constant that depends on wind friction velocity, which in turn depends on wind speed. Because this form only holds when all three processes are in equilibrium, Phillips referred to this region of the spectrum as the equilibrium range. Scientific observations of combined wind and wave observations (e.g. Thomson et al., 2013) have confirmed that the Phillips model adequately predicts the wave spectrum in the equilibrium range, which led the researchers in that paper to conjecture (paraphrased): “...wind velocity u could be determined from wave energy spectra alone”. We take this suggestion seriously.
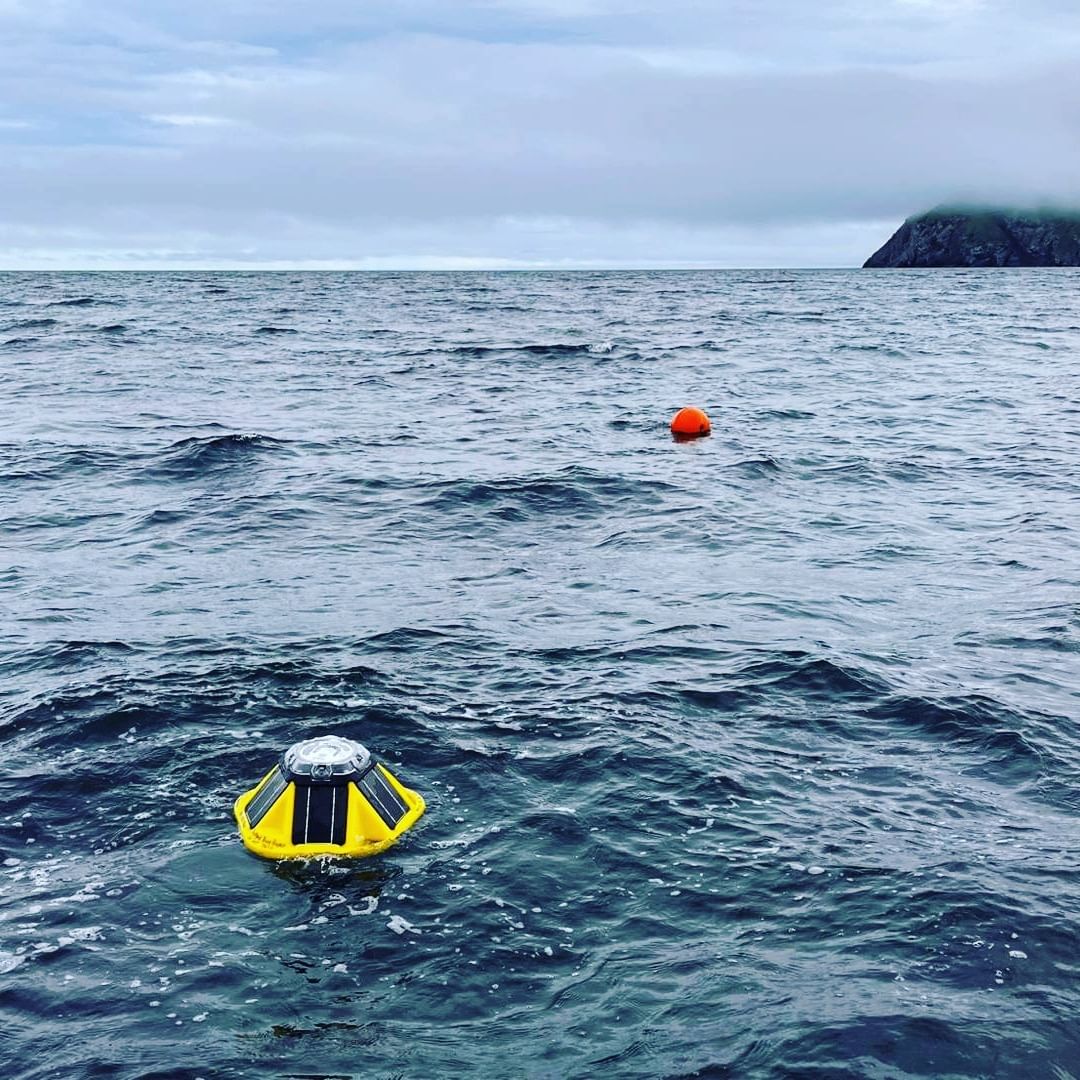
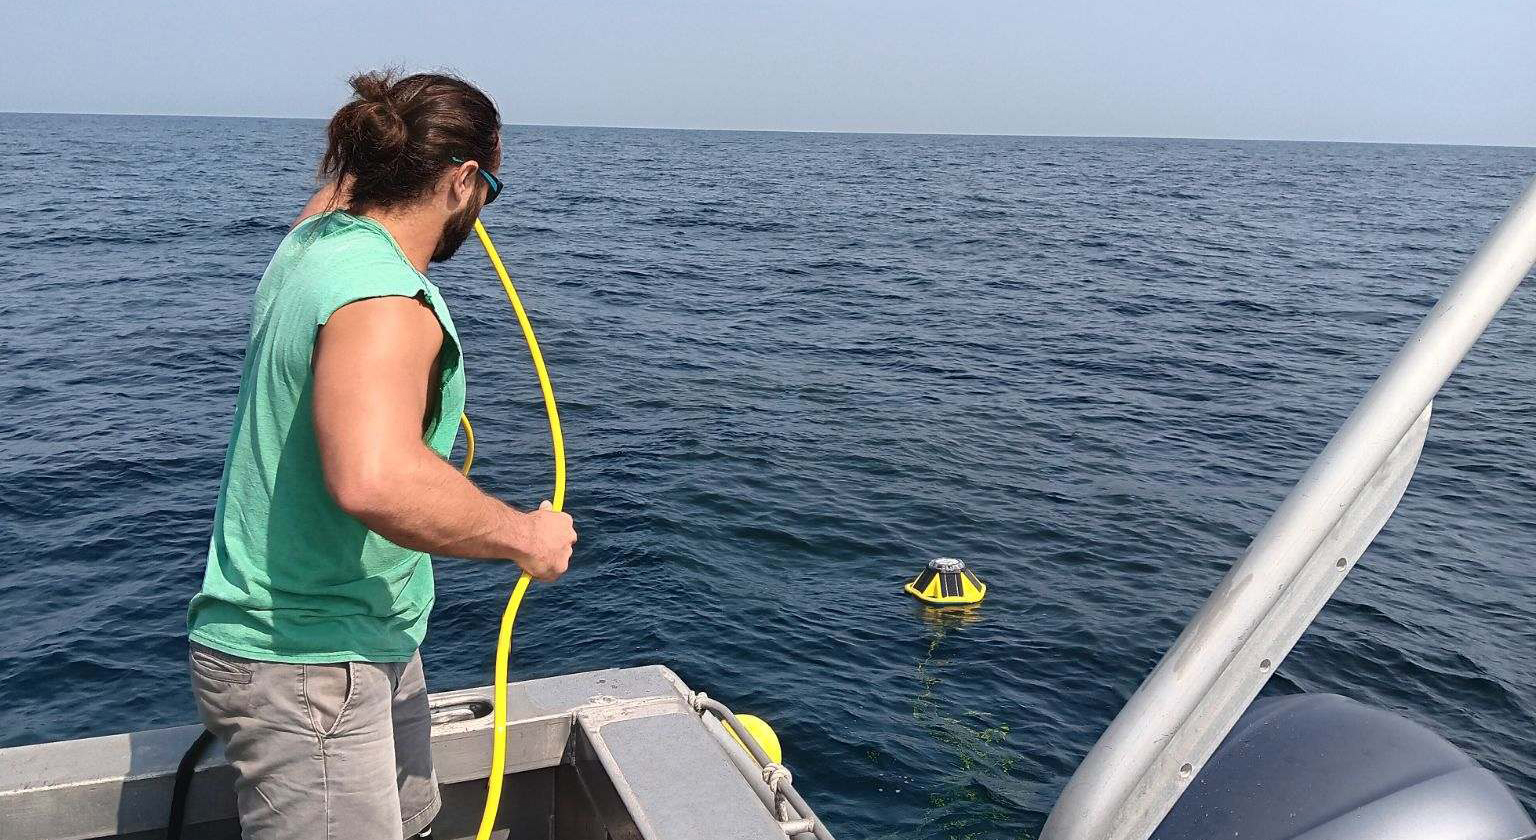
Spotter wave buoys give very accurate real-time observations of the wave spectrum. The Phillips theory suggests that if we determine the equilibrium range of the spectrum we should be able to estimate the coefficient C, and thus the wind speed. Further, since the direction of wind and the waves it generates are aligned, the direction of the waves in this range can be used to estimate the wind direction. To test this idea we moored a Spotter next to a NOAA weather station 10 miles west of San Francisco (Figure 3) in early October 2018. And the results were pretty spectacular (Fig. 3 and Fig.4). Comparisons at other locations show comparable performance and we are using decades of co-located observations of wind and waves from the NOAA National Data Buoy Center network (www.ndbc.noaa.org) to refine our algorithms. Since we estimate the wind from the waves, in rapidly changing winds our estimates may lag the conditions somewhat, since it takes some time for the wave field to adjust. Also, if a Spotter is deployed near the shore, and the wind is blowing from shore, the limited fetch could result in an underestimate of the wind speed estimate (direction is fine).
That said, we have tested our algorithm through a wide range of conditions, including periods with rapidly changing and offshore directed winds (wind was offshore directed 30% of the time, see Fig. 4), and our results have been excellent throughout. In fact, at this point the wind estimates are so good that we decided to include the wind algorithm in our 1.6.0 Spotter firmware release and the Spotter Dashboard. Your Spotter is now also a wind gauge!


* Walter Munk, a world-renowned physical oceanographer, sometimes referred to as the “Einstein of the Ocean”, made extensive contributions to a wide range of fields in ocean research. He recently passed away at the age of 101 (see https://scripps.ucsd.edu/news/obituary-notice-walter-munk-world-renowned-oceanographer-revered-scientist )