Mid January, there were two highly significant (but unrelated) events in the Southern Pacific Ocean. Tropical Cyclone Cody made landfall in Fiji and brought heavy rainfall that caused major flooding. Then, just a few days later, the Hunga Tonga volcanic eruption spewed massive amounts of ash into the atmosphere and generated a destructive tsunami. Impacts from these devastating events were felt both locally and globally. Our thoughts are with the families and communities deeply impacted by these events.
At Sofar, our mission is to build a sustainable future powered by ocean intelligence and enable the world to better prepare for and build coastal resilience to climate related events, such as tropical storms and cyclones. We have a global network of Spotter buoys to capture marine weather data with coverage across all 5 oceans. Spotters monitor wave heights, sea surface temperature, air pressure, and more. With a continuously growing network that sends data to us on land in real-time, we are able to monitor these events as they occur. During the tropical cyclone, the Sofar Spotter network captured big waves as the storm tracked from Fiji towards New Zealand and during the volcanic eruption, the Spotter network detected rapid changes to the air pressure generated by the volcano that we highlight below.
Tropical Cyclone Cody hit the Island of Fiji on January 10, 2022. In addition to heavy rainfall, the storm generated energetic waves out at sea. Since Sofar has nine Spotter buoys drifting with the ocean currents between Fiji and New Zealand, we were able to capture data and generate information about these waves. The largest wave height captured was about 8 m (26 ft) on January 14 at 17:20 UTC.
Looking back at our record of wave data in the past two years, Sofar has had 64 Spotters drift with the ocean currents in this region. These 64 buoys collected over 400,000 measurements of wave height. On a typical day wave height is usually only about 2.4 m (8 ft), that’s one-third the height of what we saw during the storm. While TC Cody generated much larger than average waves in this region, Spotters have actually recorded bigger waves in the past. On December 16th, 2020 waves up to 12.9 m (42.3 ft) were recorded.
In the figure below, we compare the distribution of wave heights recorded in ten days around TC Cody to all of our observations in this region over the past two years. The plots on the left show how many Spotter observations there are for each wave height. For example, during TC Cody, there were just under 50 observations of waves between 7 and 8 m. For both TC Cody and the long-term data record, most of the observations in this region are between 2 and 3 m waves. Almost 200,000 recordings of waves between 2 and 3 m were observed, which is about half of the total measurements in this region in the past two years.
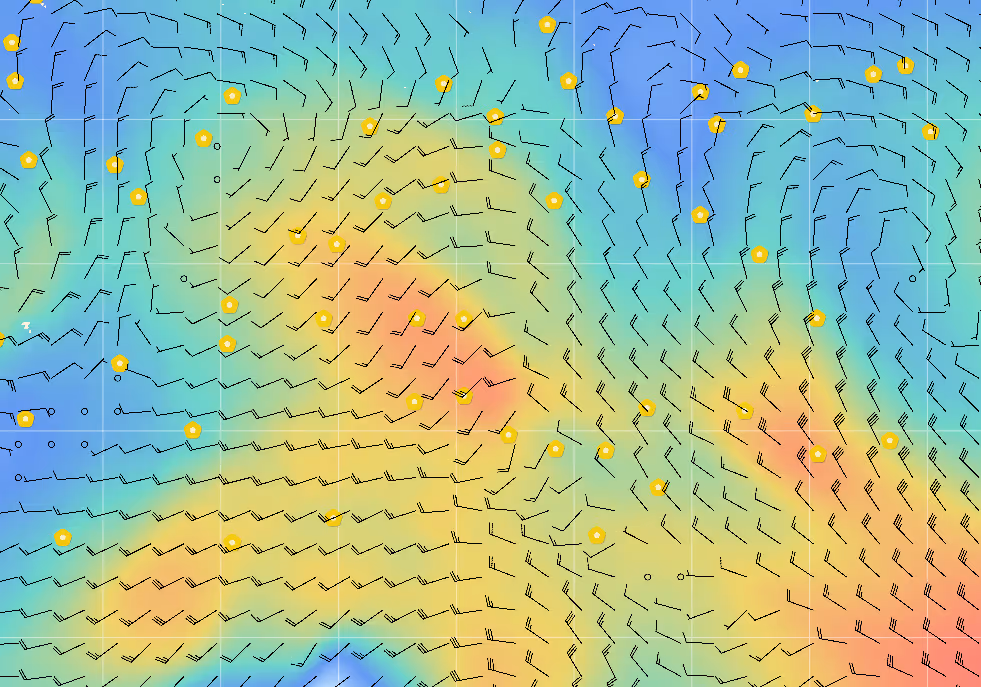
In both maps, each point marks a Spotter wave height observation colored by the wave height. As the Spotters drift in the water, they collect data every hour while they move, which is why there are often groupings of swirling lines of measurements reminiscent of the Spotter’s track. The map showing two years of data highlights how dense the Spotter coverage in this region is and it makes it challenging to identify these individual Spotter tracks. Since the typical waves in this region are small, the majority of the region is blue, but every once in a while storms, like Cody generate much larger waves, indicated by the red markers in the figure.

We use these real-time wave height observations collected on the Spotter buoys to improve weather forecasts. While current ocean weather forecasts are good, at Sofar we improve these forecasts by adding direct observations from buoys. While this is just one region, our global network collects massive amounts of data every day. This has critical impacts for ships at sea to help captains navigate around potentially dangerous weather and avoid storm systems such as Cody.
The second major natural event to occur was the Hunga Tonga volcanic eruption, which also generated a tsunami. While the name “tsunami” often evokes the vision of a huge wave visible from the shoreline, in the open ocean the waves of a tsunami are only perceivable as a change of a few centimeters in height. As such, Sofar Spotters can’t actually detect the waves of a tsunami out in the open ocean. But once that wave travels to the shore, it amplifies and creates a massive wave crashing upon land.
However, something that the Spotter buoys are able to detect in the open ocean is the atmospheric shock wave produced by the Hunga Tonga volcanic eruption. When the volcano erupted and spewed massive amounts of debris into the atmosphere, it sent a shock wave that traveled globally.
Sofar had 108 Spotters with barometric (air) pressure sensors in the ocean during the Hunga Tonga Ha'apai eruption. With this buoy network, we can calculate how fast the shock wave traveled based on how long it took the wave to reach the buoys. In the map below, each buoy is represented by a yellow marker, and the buoys we analyzed have a magenta line connecting to the site of the eruption.

A rapid spike in the air pressure occurred as the air wave passed by the Spotters. The next figure shows what the spike looks like in the data. In general, we searched for a rapid increase in air pressure, followed by a sharp decline in pressure. Depending on how far the Spotter is from the eruption site, the air pressure spike will occur at a different time. The Spotter near New Zealand, which is the closest of the three buoys from the eruption, had a spike in air pressure only 3.1 hours after the eruption. However, a Spotter 6,400 miles away near Antarctica didn’t catch the wave until 9.2 hours after the eruption.

Since we know the original location of the eruption, the distance from each Spotter at the time of the shock wave observation was calculated. The slope of the distance vs. time graph below of each Spotter observation results in the speed of the shock wave, which was 658.7 mi/hour. The shockwave traveled a bit slower than the speed of sound in air, which is approximately 764 mi/hour near the water surface and our earliest detection of the shockwave occurred 48 minutes after the eruption. Even approximately 14 hours later we were still able to detect the signal over 8000 miles away from the eruption.

While we only highlight some of the many Spotters that detected this signal as an example, there is plenty more data to analyze. In fact, though not pursued here, shockwave speed, eruption location and eruption time can all be inferred using triangulation from multiple observations. We hope that with our massive and growing sensor network, we can help scientists continue to research this phenomenon and uncover new insights. Learn more about Sofar’s Data Services and what we offer to academics and researchers in the field.