Ocean Intelligence
Made Simple
Deploy professional-grade monitoring in minutes. Get real-time data immediately. Scale effortlessly.
The Spotter Platform
A turnkey, all-in-one solution for real-time ocean data. From moored buoys to mobile vessels, every Spotter streams to the same dashboard and API.
Fixed-Point Ocean Monitoring
Moor in up to 100m of water for continuous surface and subsurface data. Measure waves, wind, and weather at the surface while extending sensing below with Smart Mooring sensors.
Spatial Survey & Gap Filling
Transit between locations to measure how conditions vary across a region. Fill coverage gaps or scout new deployment sites.
Lagrangian Monitoring
Follow currents to track conditions as they move. Deploy a Spotter buoy as a free drifter or use a Spotter Scout with return-to-home-capability.
Deep Water Station Keeping
Hold position in water of any depth without a mooring. Configure station-keeping from 50m to 10km radius. 6+ months of unattended operation.
Core Components
%203.avif)
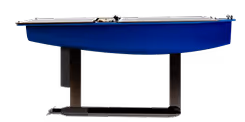
Study the Surface
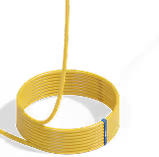
Explore Below the Surface
Monitor Without Moorings
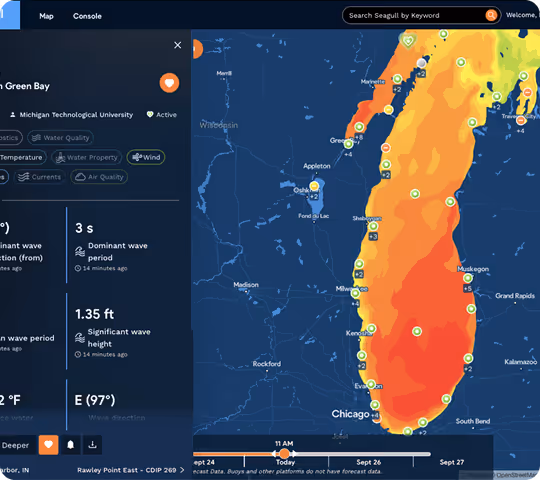
One Platform for Every Deployment
Whether your data comes from a buoy, a subsurface sensor or a mobile vehicle, it all transmits to the same Spotter Dashboard and API.

Always Connected
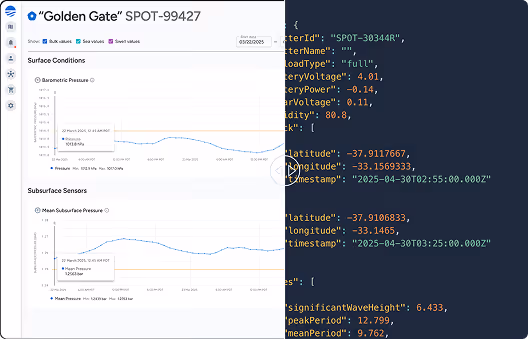
Access Data Your Way
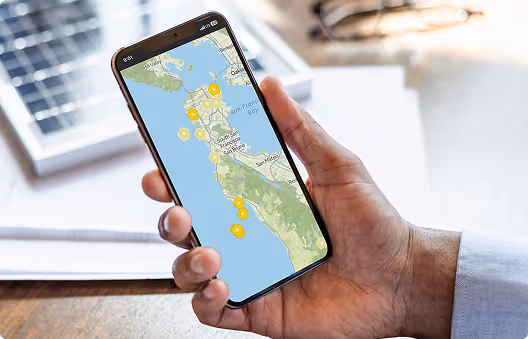
Control from Anywhere
Start with One. Build a Network.
Every Spotter you deploy amplifies your ocean intelligence. As your network grows, patterns emerge and insights multiply.

One Spotter.
Multiple Spotters.
Full network.
Powered by Bristlemouth
Spotter is turnkey and ready to deploy out-of-the-box — but its superpower is flexibility.
Plug-and-play compatibility
Effortlessly add or swap sensors via Bristlemouth — the open ocean connectivity standard — to instantly expand your capabilities and meet evolving needs.
One standard across every form factor
The same Bristlemouth sensors work on Spotter Buoy + Smart Mooring and Spotter USV. Buy once, deploy anywhere in your network.
A growing ecosystem
Bristlemouth is an open standard backed by a growing community of sensor manufacturers. Sensors you buy today work with instruments released tomorrow.
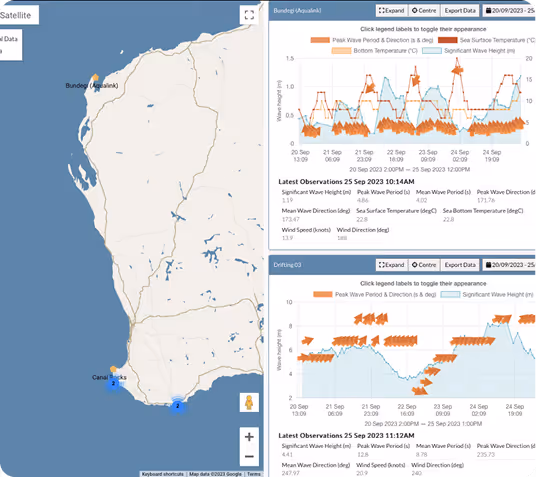
Explore Real Spotter Networks
See how organizations worldwide use the Spotter platform to build monitoring networks that drive research, safety, and decision-making.

Deployed Globally, Trusted Locally
From Arctic research stations to tropical storm monitoring, Spotter delivers reliable intelligence in nature's extremes.
Explore Our Approach →