
Sofar’s Wayfinder voyage optimization platform provides continuous, proactive, and holistic route guidance to vessels. It considers hundreds of millions of route options daily before sending waypoint and RPM recommendations based on:
In the following route demo, we use real voyage data to compare the effectiveness of Wayfinder’s continuously optimized route guidance and non-optimized route guidance that recommends preset waypoints and constant speed.
In Figure 1, we compare the two following routing scenarios for a bulk carrier traveling from Asia to the west coast of the United States:
The colored background layer in Figure 1 represents the significant wave height in the northern Pacific Ocean. Each yellow pentagon represents the position of a Sofar Spotter buoy. Weather data and the positions of the Spotters and vessels are valid for March 2, 2022, at 06:00Z. The red (parametric roll warning) and pink (synchronous roll warning) pill-shaped areas along each route represent parts of the journey identified by Wayfinder as particularly high-risk due to inclement weather.
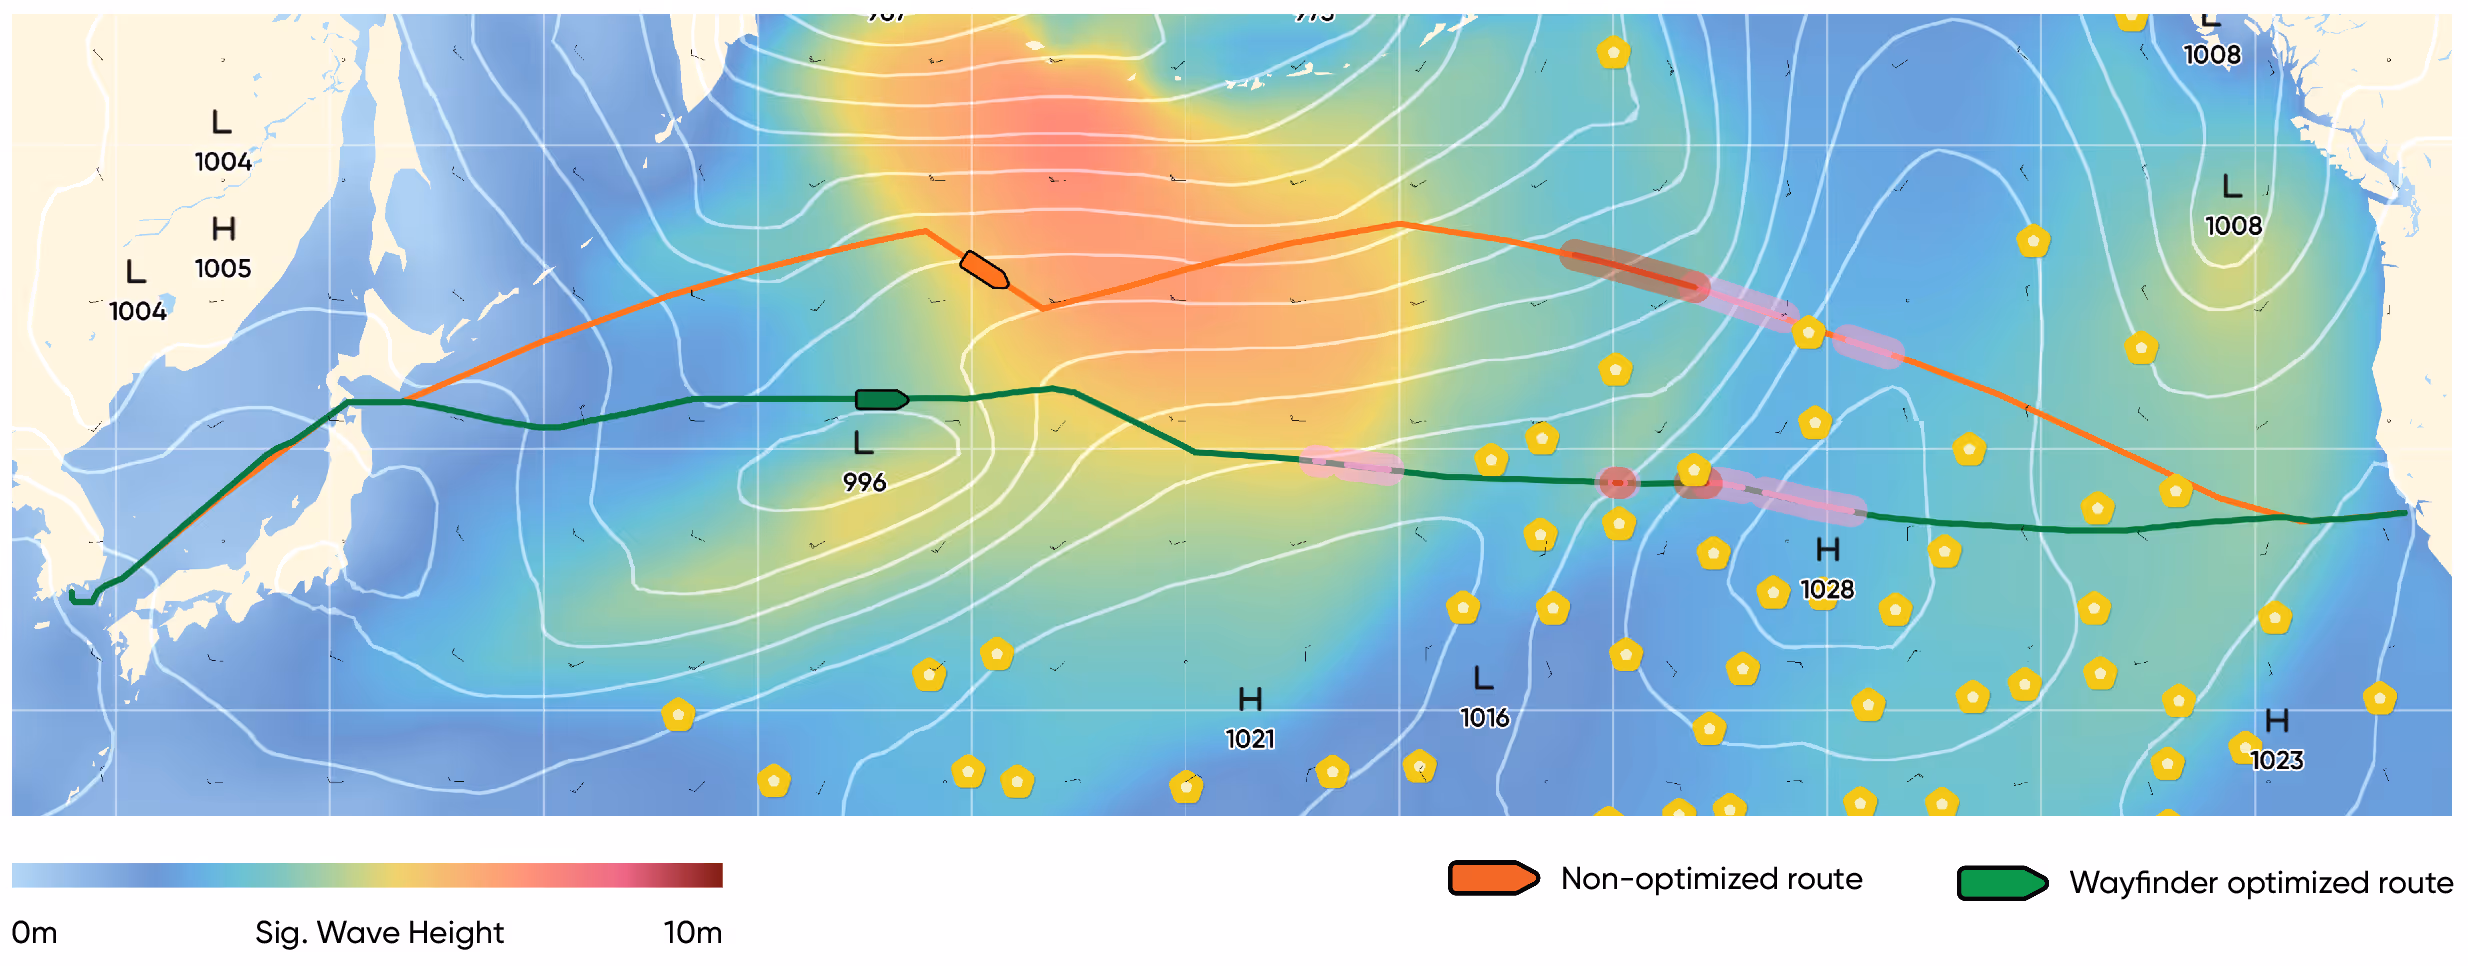
Figure 2 shows the significant wave heights encountered by the vessels in each routing scenario along their respective paths. The vessel on the Wayfinder optimized route — which we will call Vessel A — spends less time in high wave conditions compared to the vessel on the non-optimized route, which we call Vessel B. Notably, Vessel A encounters a maximum wave height of just over 5 meters, while Vessel B encounters waves larger than 7.5 meters.
.avif)
Figure 3 shows a time series of the vessels’ average RPM over 12-hour intervals along each route.
Figure 4 shows a time series of the vessels’ speed along each route.
.avif)
Three time series of the vessels’ cost of trip (Figure 5), total fuel consumed (Figure 6), and emissions (Figure 7) along each route are shown below. Cost of trip, total fuel consumed, and emissions are closely related: the more fuel a vessel burns, the greater its emissions output and voyage cost will be.
.avif)
Collectively, these times series show that:
Vessel A has superior cost, fuel, and emissions outcomes relative to Vessel B. Why? The key differentiator is the voyage guidance underpinning the Wayfinder optimized route and the non-optimized route. Let’s break it down:
Early in the voyage, Vessel A and Vessel B follow nearly identical waypoints. Vessel B travels at a constant speed of 11 knots (~5.66 m/s), while Vessel A — which is receiving daily RPM guidance from Wayfinder — travels at variable speeds that are consistently slower than 11 knots. As a result, Vessel B covers more distance and consumes more fuel than Vessel A early in the voyage.
As the vessels enter the open ocean, their paths diverge dramatically. Vessel A follows a southerly course and reduces its RPM and speed to avoid a storm system that Wayfinder forecasts will develop in the northern Pacific later in the voyage. Vessel B, which is following fixed waypoints set prior to the voyage, takes a northerly course at constant speed. This exposes Vessel B to the storm system and, despite a late diversion to avoid the storm’s effects, it sails through dangerous waves larger than 7.5 meters. Vessel A and Vessel B’s distinct courses highlight the importance of daily, continuous route guidance, as well as highly accurate weather forecasts.
White paper: The key components of an effective voyage optimization platform
After avoiding the storm, Vessel A takes advantage of calm seas and increases its RPM and speed significantly, while Vessel B continues to travel at constant speed. On March 4th, for example, Vessel A travels nearly 4 knots (~2 m/s) faster than Vessel B; during stretches like these, Vessel A makes up some of the distance and time lost earlier in the voyage when it adjusted its RPM and course to avoid the storm.
Later in the voyage, Vessel A and Vessel B both sail through stretches of rough seas; in Figure 1, these high-risk areas are represented by the red (parametric roll warning) and pink (synchronous roll warning) pill-shaped areas along each route. Vessel A consistently decreases its RPM when sailing through these treacherous areas. For example, on March 5th, Vessel A receives a high-risk synchronous roll warning from Wayfinder; in response, it decreases its RPM from ~65 to ~56, which lowers its speed by nearly 6 knots (~3 m/s). Vessel B, which sails through roll risk areas for nearly three straight days starting on March 6th, increases its RPM to as high as ~76 during this period to maintain constant speed and meet its required time of arrival. As a result, Vessel B experiences elevated safety risk and burns more fuel, further widening the gap between its energy consumption and that of Vessel A.
Ultimately, Vessel A arrives at port just three hours after Vessel B, despite traveling an additional 134.86 nautical miles. Vessel B’s minimal time savings come at an extremely high cost: it spends $13,463.78 more dollars, burns 31.08 MT more fuel, and produces 88.82 MT more CO2 emissions than Vessel A.
By following Wayfinder’s route guidance, Vessel A accesses continuously optimized RPM and waypoint recommendations, allowing it to sail as efficiently as possible given changing ocean weather and economic factors. By sailing at a constant speed with inflexible waypoints, Vessel B becomes more susceptible to inclement weather and suboptimal voyage outcomes. Whether maintaining constant speed, power, or route, sailing without continuous optimization will always produce inferior results.
To learn more about Wayfinder, check out its product page. To schedule a demo with the Wayfinder team, please fill out this short form.


