Ocean swells travel great distances, moving thousands of miles across the sea before they reach the coast. In the open ocean, swell waves have a major impact on vessels, causing unwanted rolling that can create dangerous conditions at sea and lead to cargo losses on container ships. Once they reach the coast, swells take on a more familiar form, acting as the catalyst for great surf or combining with high tides to wreak havoc on shorelines and cause coastal flooding and erosion.
At Sofar, we use measurements of wave energy collected by our Spotter buoys to improve our forecasts. In this blog, we’ll demonstrate how wave buoy data helps us more accurately predict the arrival of ocean swell.
Recently, 6 m swell waves crashed upon the shores of Hawai’i. 6 m waves are nearly 20 ft tall, which by Surfline’s layman standards are classified as "it’s just really big!" To give you a sense of scale, a 20 ft wave is the same size as two basketball hoops stacked on top of one another. Footage of the swell waves sweeping away tables and chairs during a wedding ceremony went viral, and O‘ahu lifeguard and rescue teams responded to at least 1,960 rescue calls during the weekend of the swell event. Read lifeguard accounts from the weekend in Outside’s article Inside One of the Craziest Long Weekends of Lifeguard Rescues in Oahu History.
How do waves like these form? As strong winds blow against the ocean surface, they generate wind waves. If winds are sustained over a long period of time, short wind waves transform into long period waves. As the waves propagate away from the storm, the longer waves travel faster, and the wave field separates into long period energetic fore-runners, and less energetic shorter period waves. The leading waves are what we typically call swell. We capture this difference by measuring the wave period, or the time it takes for two wave crests to pass by a given location. If you are on a ship during a windy storm, a lot of wind waves would pass under the ship in a short amount of time. There might be some white capping on the waves and you might feel the waves coming from all different directions as the boat rocks and rolls. Swell waves have much larger wave periods, so if you are on a boat far away from the storm, the boat would slowly roll in the direction of the waves as the ocean swell propagates.

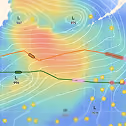
The swell that produced the waves in Hawai’i started about 4,500 miles away, the result of a major storm in the Southern Ocean, just east of New Zealand. In Figure 2 below, the maps highlight how far the ocean swell waves traveled in the five days it took them to reach Hawai’i. The upper panel shows the significant wave height, which is the average of the upper third of individual wave heights. The bottom panel shows the peak period, the period in which we measured or predicted the most wave energy. The regions where the peak period is longest show the location of the swell waves.

The swell waves traveled at a speed somewhere in between that of a car and a cargo ship. If you were driving the distance the waves propagated in a car on the highway, it would take you three days of driving 65 mph (without stopping!) to reach Hawai'i. A cargo vessel could traverse the same distance in about a week.
The fact that the swell moved at a faster pace than a standard cargo ship is significant. A ship could be thousands of miles away from a storm, but still feel the impact of the swell waves that the storm creates. Thus, it is critical for ships at sea — using tools like our Wayfinder platform — to access accurate predictions of wave height and period.
Figure 3 displays animations that show how wave forecasts of the swell changed over time. In the upper panel, the storm generates large waves in the Southern Ocean. As time progresses, the peak period animation in the lower panel shows how the swell waves propagate outward from the storm and eventually reach the coast of Hawai’i.
Figure 4 below shows how our forecasts of the Hawai’i swell compare to those produced by the European Centre for Medium-Range Weather Forecasts (ECMWF). Each forecast’s performance is measured against the actual observations recorded by a Spotter buoy just south of Hawai’i. In the upper panel, we compare the significant wave height of the swell waves. You’ll notice that the Sofar forecast predicts the waves to be upwards of 2 m at this buoy, which is consistent with what was actually observed. ECWMF slightly under-predicts the largest significant wave height and predicts wave heights to start increasing sooner than they actually did.
In the lower panel, we compare peak period. Since swell waves have long wave periods, the time at which the swell waves reach the buoy is indicated by the large jump in peak period. Comparing forecasts from July 13th — three days before the swell waves arrived at this buoy's location — we see that the ECWMF forecast predicted the swell to arrive 12 hours too early, while the Sofar forecast closely predicted the arrival time.

These forecast differences can have major implications at sea. Imagine you are a ship Captain trying to plan your voyage and there is a large storm in the distance. While the storm may be far away, because swell waves propagate across ocean basins, they could impact your journey. The ability to accurately predict days in advance whether or not the storm’s swell waves will cross your path is critical. Sofar's ocean weather forecasts, which are the engine powering our Wayfinder dynamic voyage optimization platform, unlock that predictive power.
To learn more about our forecasting approach, check out our two-part series on data assimilation (Part I, Part II). To read up on our Wayfinder dynamic voyage optimization platform, peruse our recent Wayfinder blog.