
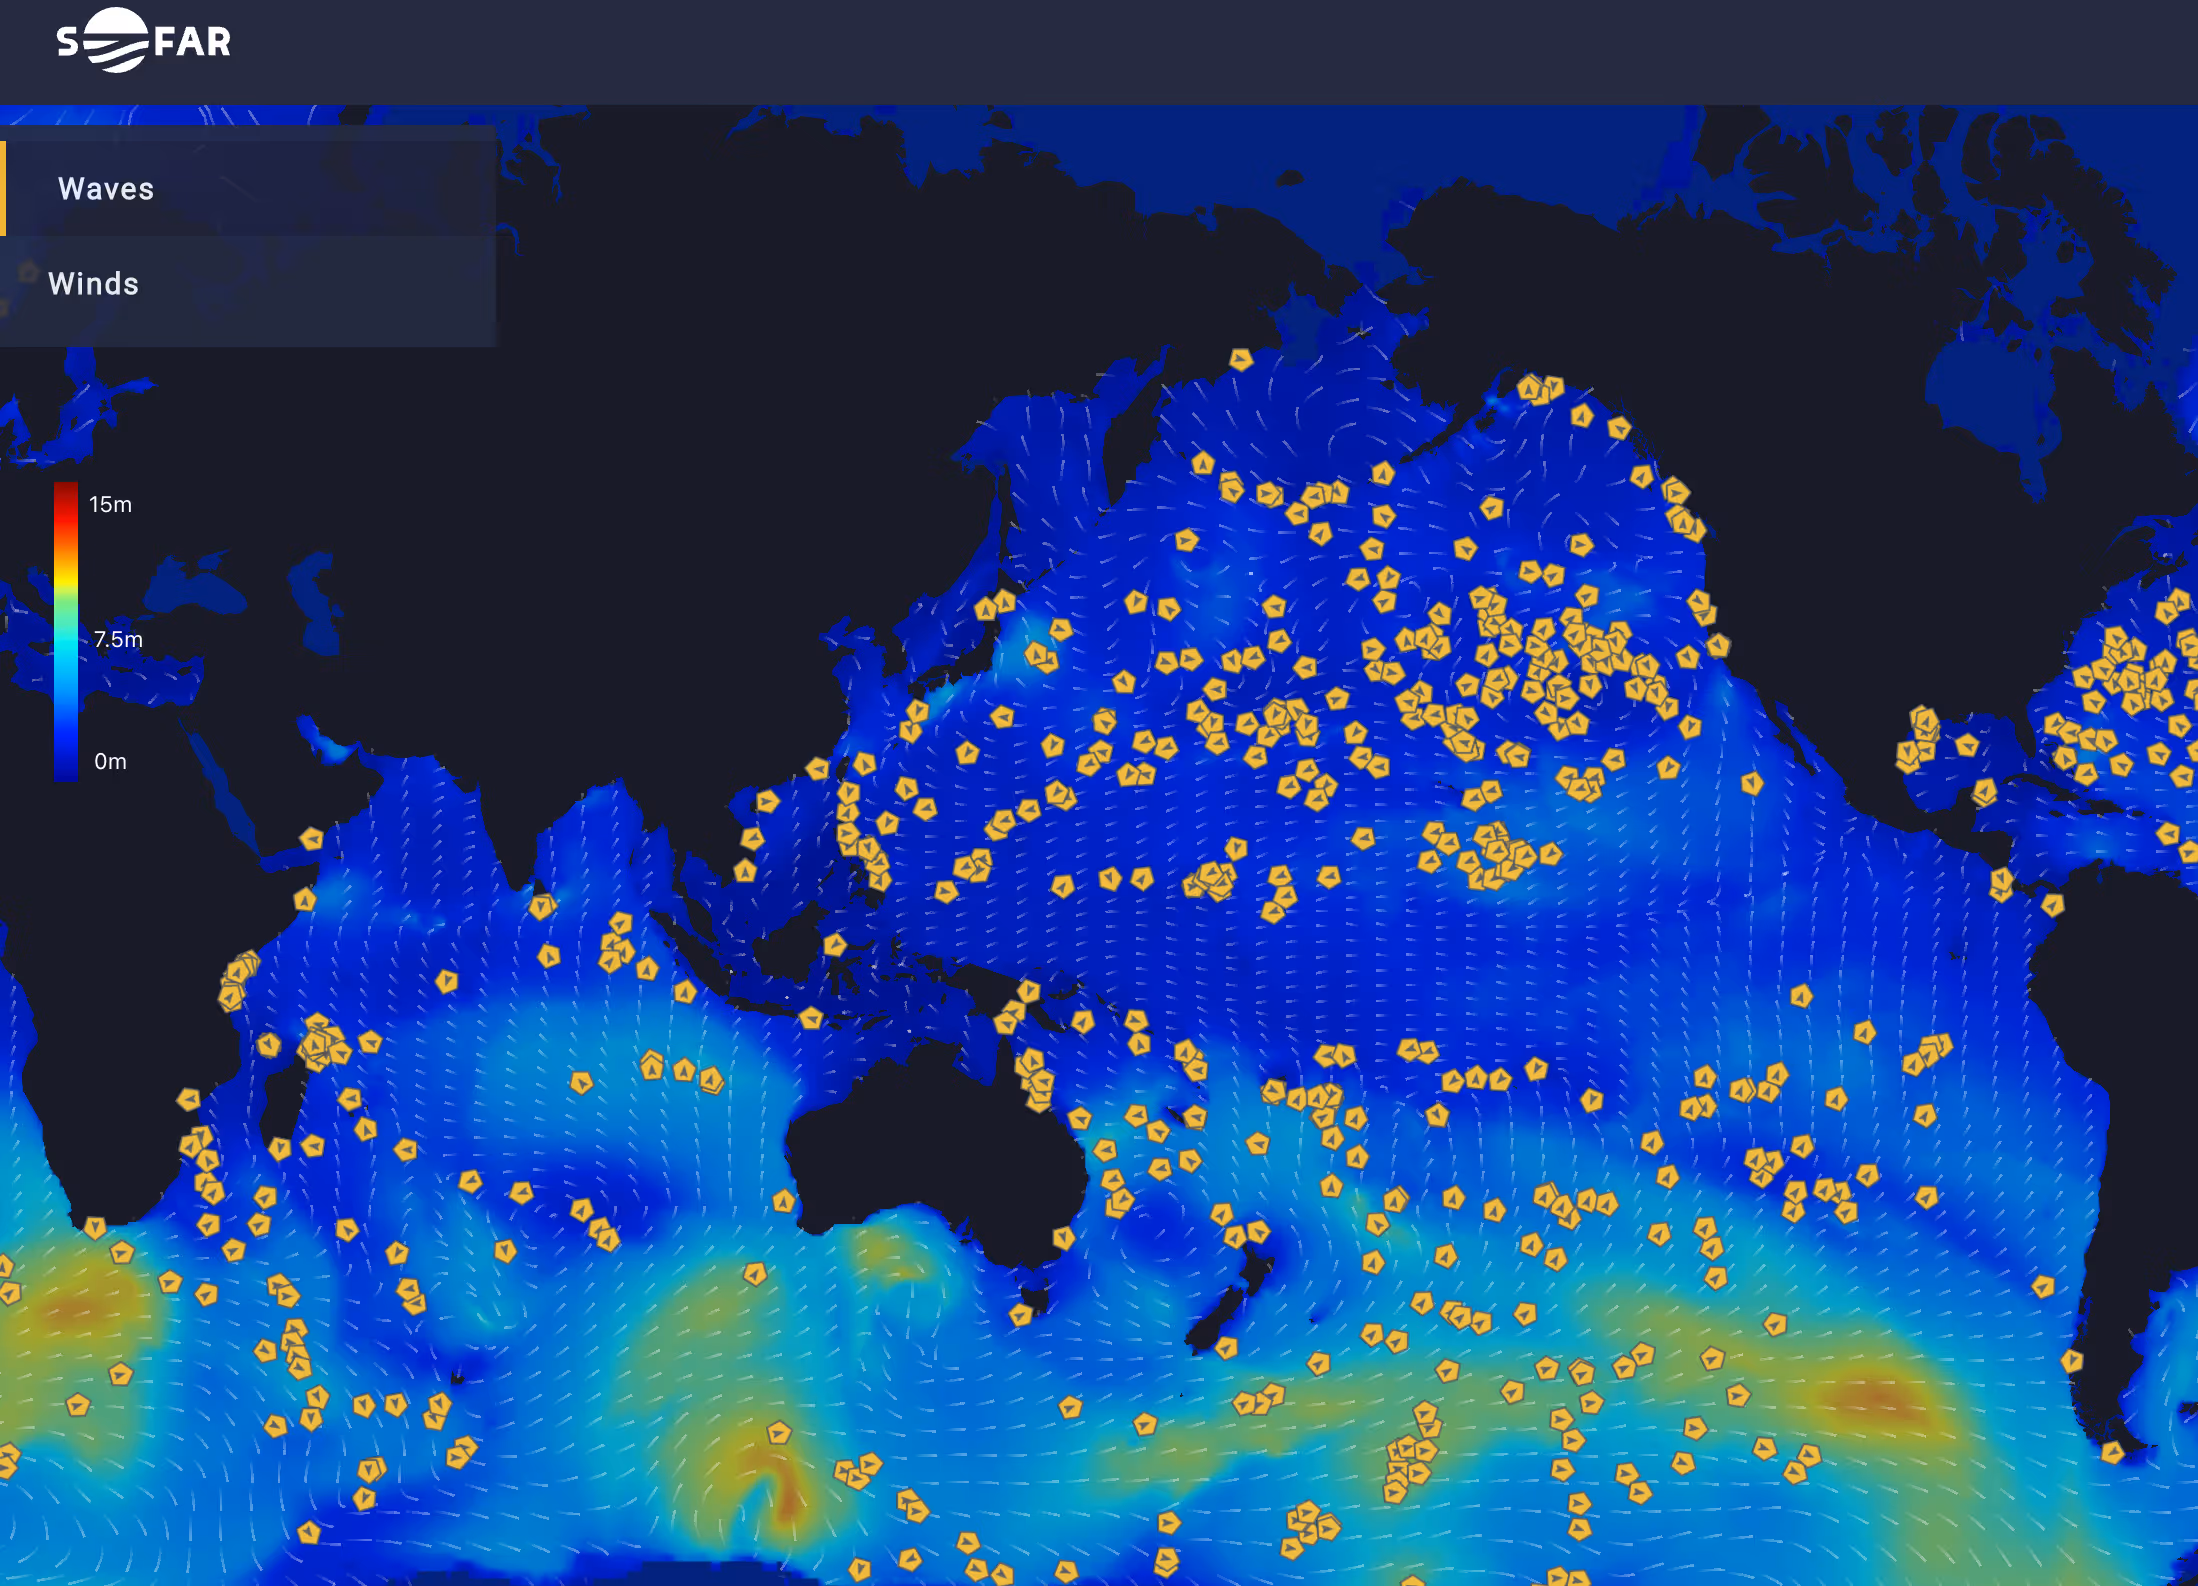
At Sofar, we assimilate the real-time ocean data collected by our vast network of Spotter buoys into our accurate operational ocean weather forecasts. These unique observations and innovative forecasts have empowered us to explore new frontiers in the voyage optimization space via our Wayfinder platform.
To stay on the leading edge of both wave forecasting and voyage optimization, our Ocean Science and Data teams are always innovating and experimenting with new data-driven methodologies to improve our model.
In August 2022, we achieved a first in the weather forecasting field: operationalizing a global forecast model that assimilates both spectral wave data from buoys and wave height observations from satellites.
To fully grasp the impact of assimilating satellite wave height data, it is first critical to understand Sofar’s forecast advantage: real-time ocean observations. Our network of Spotter buoys distributed across all five oceans collects wave data in real-time, unique observations that we assimilate into our marine weather forecast. This real-time data corrects the “now” state of the forecasts, which in turn improves our wave predictions in the future. By incorporating this spectral wave buoy data, we generate global wave forecasts that are 40% more accurate than leading government forecast centers.
While we continue to expand our global sensor network, we are always striving to improve our forecasts by integrating additional sources of wave height data, such as observations from satellite altimeters.
Each day, government-operated satellites circle Earth multiple times and take snapshots of our global oceans’ sea state. Some of these satellites are equipped with altimeters, onboard sensors that measure altitude (i.e. height above sea level). Altimeters send a pulse of light energy down to Earth that gets reflected off of its surface and sent back to space. The altimeter measures the time it takes for the satellite to emit this light energy and detect the return signal, and uses this information to better understand Earth’s surface. In an oceanographic context, altimeter measurements are translated into observations of wave height, sea surface height, and ocean currents. These observations provide critical insights and are incredibly important for the long term monitoring of sea level rise due to climate change. To learn more about how our wave buoy observations relate to wave observations from satellite altimeters, check out our peer-reviewed publication here.
At Sofar, we saw an opportunity to assimilate the wave height measurements made by three different satellite altimeters — Jason-3, SARAL (Satellite with ARgos and ALtiKa), and Sentinel-6A — and use them in concert with the observations made by our continually expanding buoy network.
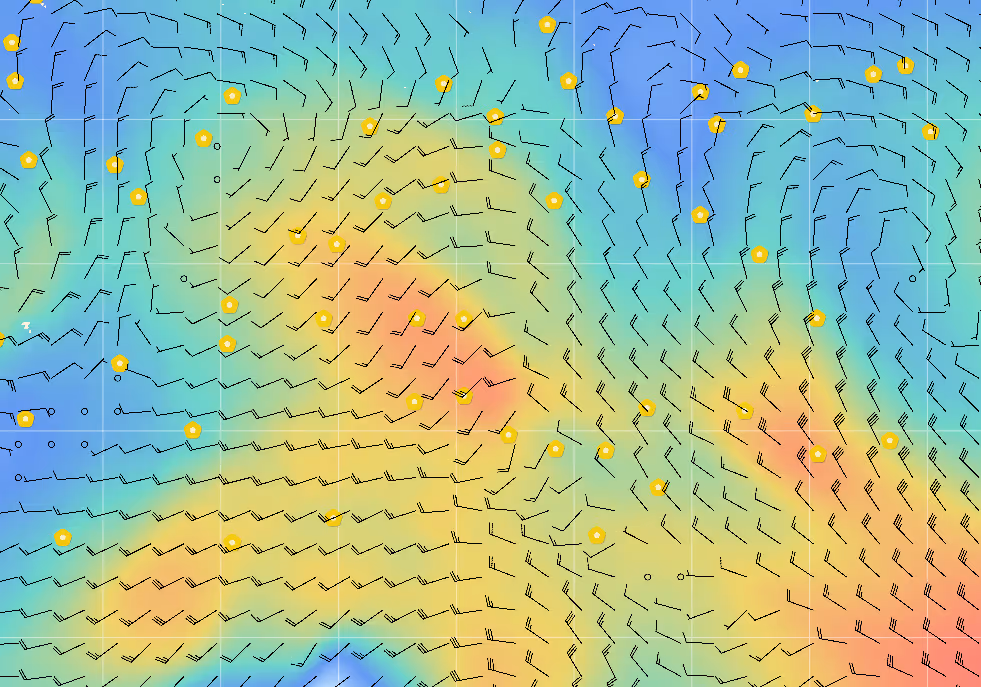
In the animation in Figure 1 below, watch as the satellite altimeter track (blue lines) sweeps across Earth and crosses over our network of Spotter buoys (black dots). As satellites orbit the Earth, they collect a swath of information, which is essentially a long strip of data (see blue lines in Figure 1). Even though one hour of satellite data collection translates to less spatial coverage than that provided by our global buoy network, the satellites enable us to obtain observational data in areas of the ocean that are sparsely populated by Spotters, due to either a lack of buoy deployments or because it is hard to retain free drifting buoys in that area. Near the equator you can see that there are very few buoys, the result of divergent currents that flow away to the North and South and push the devices out of the region. In areas like these, the assimilation of wave height observations from satellites is particularly beneficial. Therefore, these distinct data sources work best when used together, with buoy observations providing widespread, granular coverage, and satellite altimeter data filling in regional gaps.
In Figure 1, the complementary nature of buoy and satellite data is on display. The background colors show where the assimilation of altimeter observations corrects our forecast model to larger (blue) and smaller (red) significant wave heights. The addition of satellite data has a global impact.

Traditional forecasting centers, like The European Centre for Medium-Range Weather Forecasts (ECMWF), rely on satellite altimetry data for their wave forecasts. Now that we are also incorporating satellite data into our forecasts, our team can make more direct comparisons between our forecasts and those produced by other forecasting centers. This is particularly useful for highlighting the added value that our Spotter buoy observations have on our forecast’s accuracy, as they are an input that is exclusive to our model.
In Figure 2 below, we measure the forecast error of the ECMWF forecast (gray lines), our forecast with assimilated Spotter data (green lines), and our forecast with assimilated Spotter data and assimilated altimeter data (blue lines), when compared to altimeter observations (left graph) and Spotter observations (right graph).
Validating our forecasts against both the altimeter and Spotter observations shows that during the 18-day comparison period assimilating both Spotter and altimetry data produced the most accurate forecast.

Early results suggest that our combined satellite and Spotter data assimilation approach results in forecast improvements over traditional operational centers both when validating against altimeter data and Spotter data. When we validate our forecasts against Spotter wave buoy observations, the improvement in forecast accuracy over traditional centers extends to 1.5 days out, and is up to 5% more accurate (see Figure 2, rightmost graph). These are preliminary results, which our team is excited to share and build on as we continue to conduct more research and testing.
No improvement to the Sofar operational wave forecasting system would be possible without the day-in, day-out work of our talented team. Special thanks to all of the team members that powered this effort, particularly our Ocean Science team. The satellite altimeter data assimilation project was completed in just over two months, a perfect embodiment of one of our core values, “shipping for impact.” Keep tabs on our blog to hear about future forecast updates!


.jpg)