
Off the coast of Costa Rica and neighboring Central American countries, a permanent upwelling system pulls cold, nutrient-rich water to the ocean's surface year-round. That upwelling supports phytoplankton blooms that feed an entire marine food web. Blue whales migrate thousands of miles to feed here. Sharks, tuna, and sea turtles concentrate in the area. Known as the Thermal Dome, it has been designated an Important Marine Mammal Area and supports an estimated $1.58 billion in economic activity.

The Dome also sits directly in the path of major trans-Pacific shipping routes to and from the Panama Canal. Container ships and tankers pass straight through this area, not around it. That's a problem, because at 15 knots a vessel strike has roughly an 80% chance of being fatal to a whale, and between 2019 and 2021, nearly 1,000 ships traveled faster than 15 knots through the Thermal Dome.
A coalition of conservation groups, including the MarViva Foundation, has been working to change that. Their goal: designate the Thermal Dome as the first-ever Particularly Sensitive Sea Area (PSSA) on the high seas, a classification under the International Maritime Organization that could introduce speed limits and routing adjustments for vessels transiting the region. In January 2026, the Biodiversity Beyond National Jurisdiction (BBNJ) Agreement entered into force, creating a new global framework for marine protected areas in international waters and making the Thermal Dome a leading candidate for protection.
To build the case, they needed to answer a question the shipping industry would inevitably ask: what would this cost us?

BIMCO, one of the world's largest international shipping associations, joined the effort early. Their members include many of the companies whose vessels transit the Thermal Dome, and BIMCO had a hypothesis they wanted to test. They believed that if vessels either rerouted around the Thermal Dome or slowed down while passing through it, the added cost to operators would be low enough to keep protective measures on the table.
The problem was they had no way to quantify it. That's where our team at Sofar Ocean came in. BIMCO was familiar with our Wayfinder voyage intelligence platform and had recently heard about a new capability we'd released: Wayfinder Voyage Simulator.
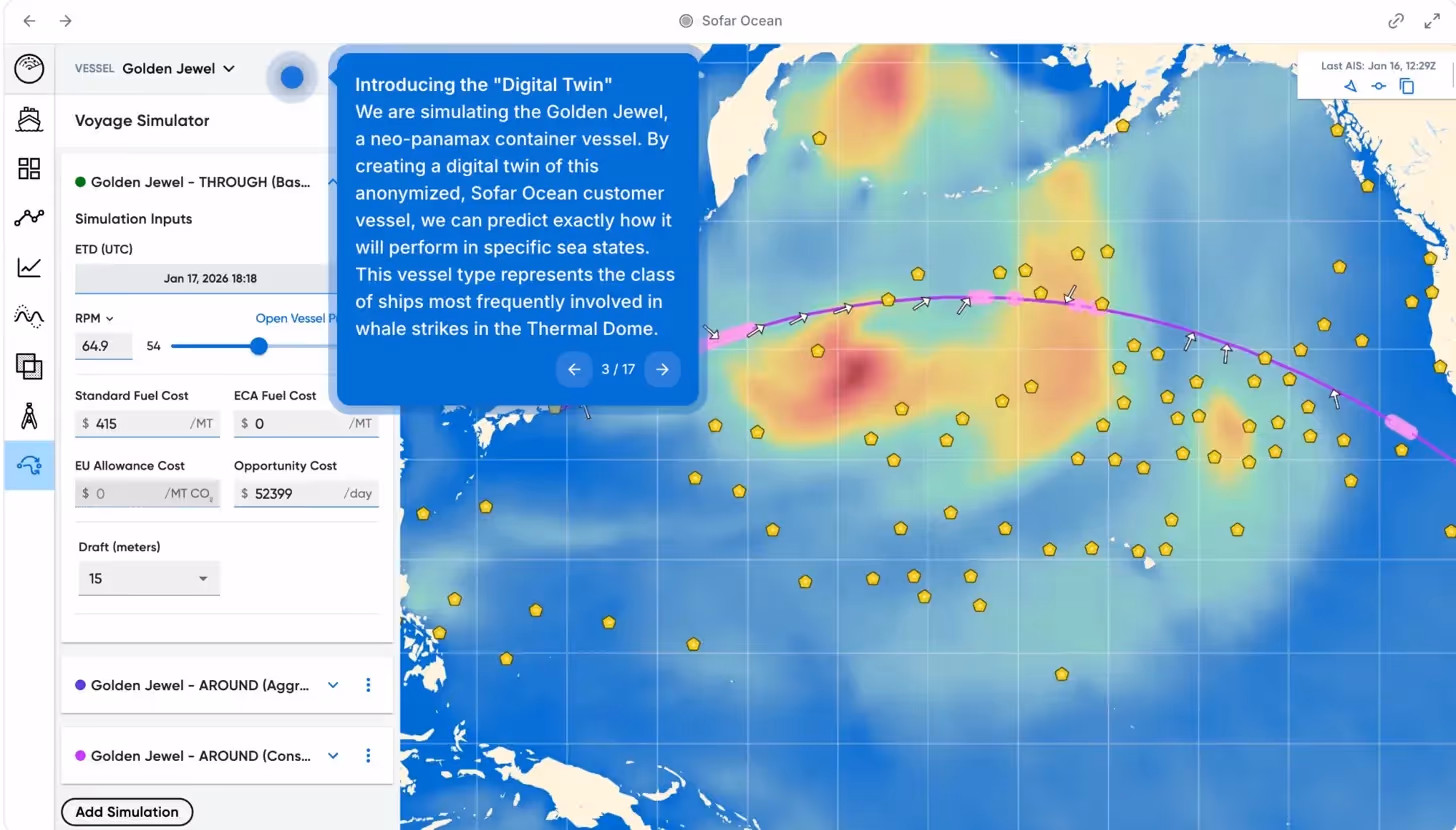
To run any simulation in Voyage Simulator, you need a vessel performance model. This is what makes the estimates accurate: the simulator needs to know how a specific vessel type responds to different sea states, speeds, and loading conditions. For this analysis, we needed a model that matched the type of ship most often involved in whale strikes in the Thermal Dome: fast-moving panamax container ships.
Wayfinder maintains vessel performance models across a wide range of ship types and sizes. We selected an anonymized Sofar Ocean customer vessel, a neo-panamax container ship we'll refer to as the Golden Jewel. Its performance profile served as the digital twin for our analysis.
With the Golden Jewel loaded in Wayfinder Voyage Simulator, we had our starting point.
Before walking through the analysis, it helps to understand what powers the simulations.
Sofar Ocean operates a global network of Spotter buoys that collect direct observations of wave height, period, direction, and other met-ocean data. We combine those observations with data from ECMWF and other sources to produce marine weather forecasts that are up to 50% more accurate than traditional models. Those forecasts are what Voyage Simulator uses to estimate the conditions a vessel will encounter along any given route.

The second component is the vessel performance model. Because we know how a vessel like the Golden Jewel responds to different sea states at different speeds, the simulator can calculate expected fuel consumption, voyage duration, and total cost for any scenario we define. That cost calculation factors in fuel price, the vessel's daily hire rate (its opportunity cost), and other market inputs.
Together, these two components allow you to ask "what if" questions about any voyage and get back concrete estimates grounded in real ocean data. What happens if we change the route? What if we slow down? How do those choices affect fuel burn, travel time, and total cost? Voyage Simulator answers each of those questions instantly and lets you compare scenarios side by side.
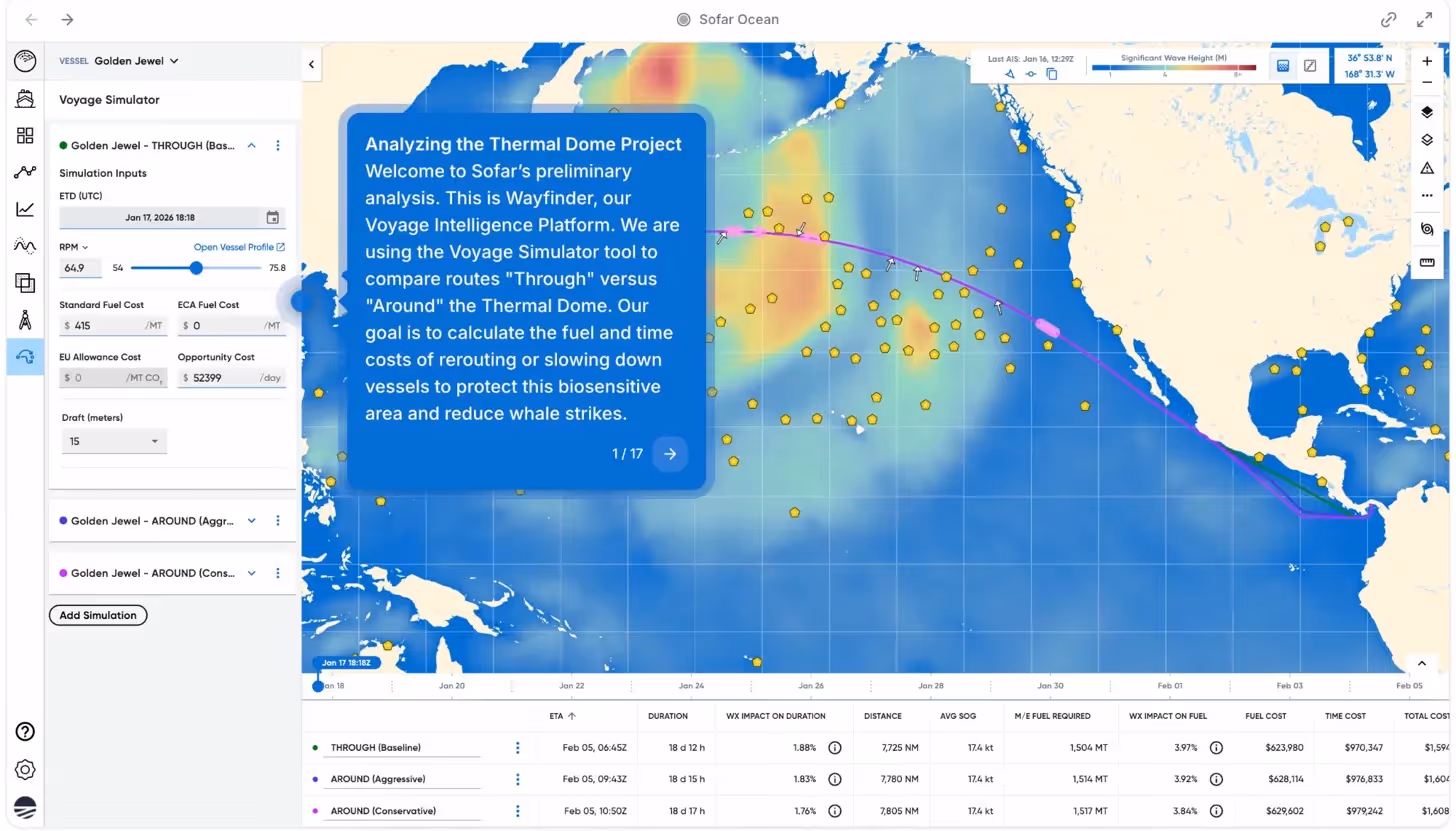
Every good comparison needs a control. Our first simulation represented the status quo: the route vessels currently take, cutting directly through the Thermal Dome at 15 knots.
We set the speed input to SOG (Speed Over Ground) at 15 knots, matching the typical operating speed for container ships on this route. We also made a deliberate choice about weather data. We wanted to control for potentially abnormal weather conditions that could skew the comparison. Wayfinder generates a 15-day forecast using real-time data, but when a voyage extends beyond that window, it defaults to mean field estimates, which are monthly or seasonal averages of conditions. We intentionally scheduled the simulation beyond the 15-day forecast window so that Wayfinder would use these mean field estimates, giving us a stable and representative weather baseline rather than one that might be influenced by a passing storm system or an unusually calm week.
With those parameters set, the baseline simulation populated in the comparison table at the bottom of the Wayfinder Voyage Simulator interface. We could already see the duration, distance, fuel consumption, and total cost for this scenario at a glance.
Now for the interesting part. The Thermal Dome shifts in size and location throughout the year, so we didn't have an exact geofenced boundary to work with. Instead, we created two alternative routes that avoided the Dome to different degrees.
The process was simple. We duplicated the baseline simulation, then adjusted the waypoints along the portion of the voyage that passes through the Thermal Dome region, rerouting the vessel to arc around it. The first variant was an aggressive reroute that cut fairly close to the Dome's estimated boundary. The second was a more conservative route that swung wider, offering a higher degree of confidence that the vessel would fully clear the sensitive area.
Everything else stayed identical: same vessel, same departure date, same speed, same weather assumptions. The only variable was the path through that stretch of ocean.
We could see the simulations recalculating in real time as we adjusted each route, and all three scenarios appeared in the comparison table simultaneously, ready to be measured against each other.
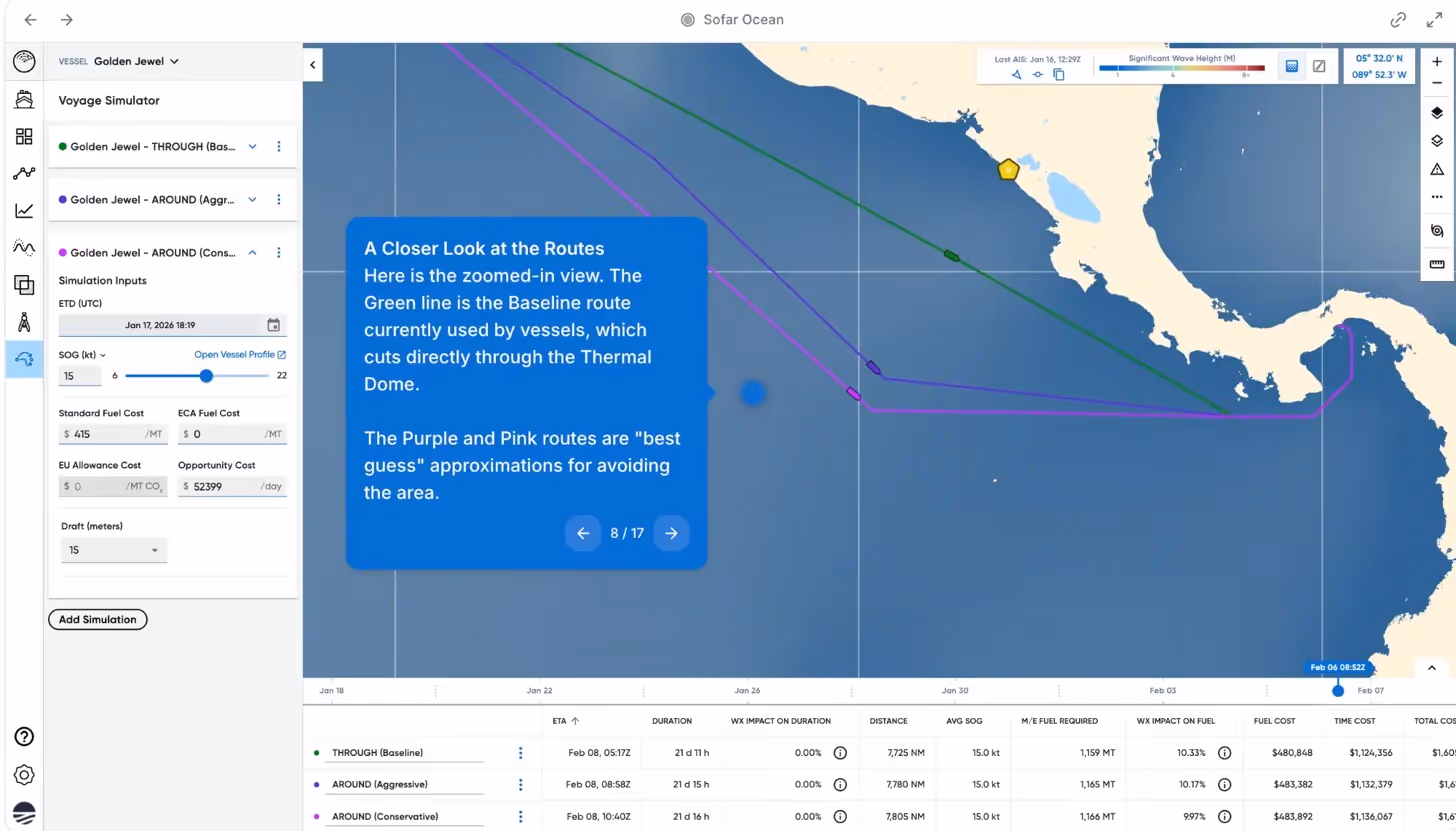
This is where Wayfinder Voyage Simulator's comparison feature showed its value. By toggling on the comparison view, the table shifted from raw numbers to deltas: the difference between each alternative and the baseline, column by column.
The aggressive reroute added 55 nautical miles and about 4 hours. The conservative reroute added 80 nautical miles and roughly 5 hours. Fuel consumption increased by 6 to 7 metric tons.
There was also a pleasant surprise. When we toggled the ocean current overlay in Wayfinder, we could see that the "Around" routes benefited from favorable currents that the direct route did not encounter. That efficiency boost partially offset the extra distance.

The bottom line: the aggressive reroute added approximately $10,600 to the total voyage cost. The conservative reroute added about $14,800. Against a baseline total voyage cost of over $1.6 million (including fuel and time costs), those figures represent less than 1% of the total.

Rerouting is one option. But what if vessels kept the same direct route and simply reduced speed through the Thermal Dome?
We ran a second analysis to test this. Instead of changing the route, we duplicated the baseline and adjusted only the speed. We created two slow-down scenarios: one at 12.5 knots and one at 10 knots, which is the globally recognized safe speed often mandated in whale protection zones.
The dynamics were different from rerouting. Slowing down added no extra distance, but it added meaningful time: 8 hours at 12.5 knots and 19 hours at 10 knots. The upside was fuel. Slower vessels burn significantly less per mile, and the 10-knot scenario saved over $17,000 in fuel costs compared to the baseline. But for container ships, time carries its own price. The vessel's opportunity cost increased by over $41,000 at 10 knots, more than offsetting the fuel savings.
The net result: slowing to 10 knots saved roughly $17,000 in fuel but added over $41,000 in time cost, for a net increase of about $24,000. More expensive than rerouting, but still a modest figure in the context of a trans-Pacific voyage.
Getting the data was one thing. Presenting it in a format that told a clear, guided story was equally important. We built interactive demos that walk viewers through each analysis step by step, showing how each simulation was configured and what the comparison revealed. These demos were embedded in the materials that BIMCO and the conservation coalition submitted to governing bodies and presented at international forums.
Explore the rerouting analysis yourself: Rerouting Demo
Both analyses supported BIMCO's hypothesis. The preliminary results suggest that the cost of rerouting around or slowing down through the Thermal Dome falls within a range that shipping operators could reasonably accept. Rerouting added a small percentage to the total voyage cost. Slowing down carried a higher price tag driven by opportunity cost, but produced meaningful fuel savings in return. In both cases, the financial impact appears modest enough for protective measures to be operationally feasible.
Our Principal Scientist, Pieter Smit, put it well: the simulations show that routing around the Dome adds roughly 1% to both voyage distance and time. When you can quantify trade-offs at that level of precision, it creates a stronger foundation for conversations about what's operationally realistic.
The findings have already been shared with stakeholders across the shipping and conservation communities, and the coalition behind the Thermal Dome PSSA proposal continues to build its case. As more marine protected areas are proposed under the BBNJ Agreement, the shipping industry will face similar questions about operational trade-offs in other sensitive regions. Wayfinder Voyage Simulator is built to answer them.
If you're interested in exploring what Voyage Simulator can do for your own fleet or research, get in touch with our team of experts.


.jpg)

