A deep dive into the latest Spotter Dashboard updates, including a redesigned interface, expanded data visualization tools, and improved device management capabilities.
We are excited to announce upgrades to the Spotter Dashboard, including a redesigned interface, improved performance, and new visualization and device management capabilities. These updates make it easier to explore data, manage larger fleets, and collaborate across teams, all without changing how your devices operate in the field.
This post highlights what’s new, what hasn’t changed, and how you can fully leverage the new Spotter Dashboard experience.
TL;DR — What This Means for You
Faster, more responsive dashboard, especially for large fleets
Improved data visualizations and map interactions
New data products (Wave Spectrum, Second-resolution Spectrogram)
Clearer device status, alerts, and visibility over integrated sensors
Ability to share links to specific data moments
Seamless integration with updated subscriptions and billing
No changes to device behavior, sampling, or data formats
The redesigned Spotter Dashboard includes an upgraded interface, expanded data visualization tools, and improved device management capabilities.
What’s New
Improved Data Visualization & Navigation
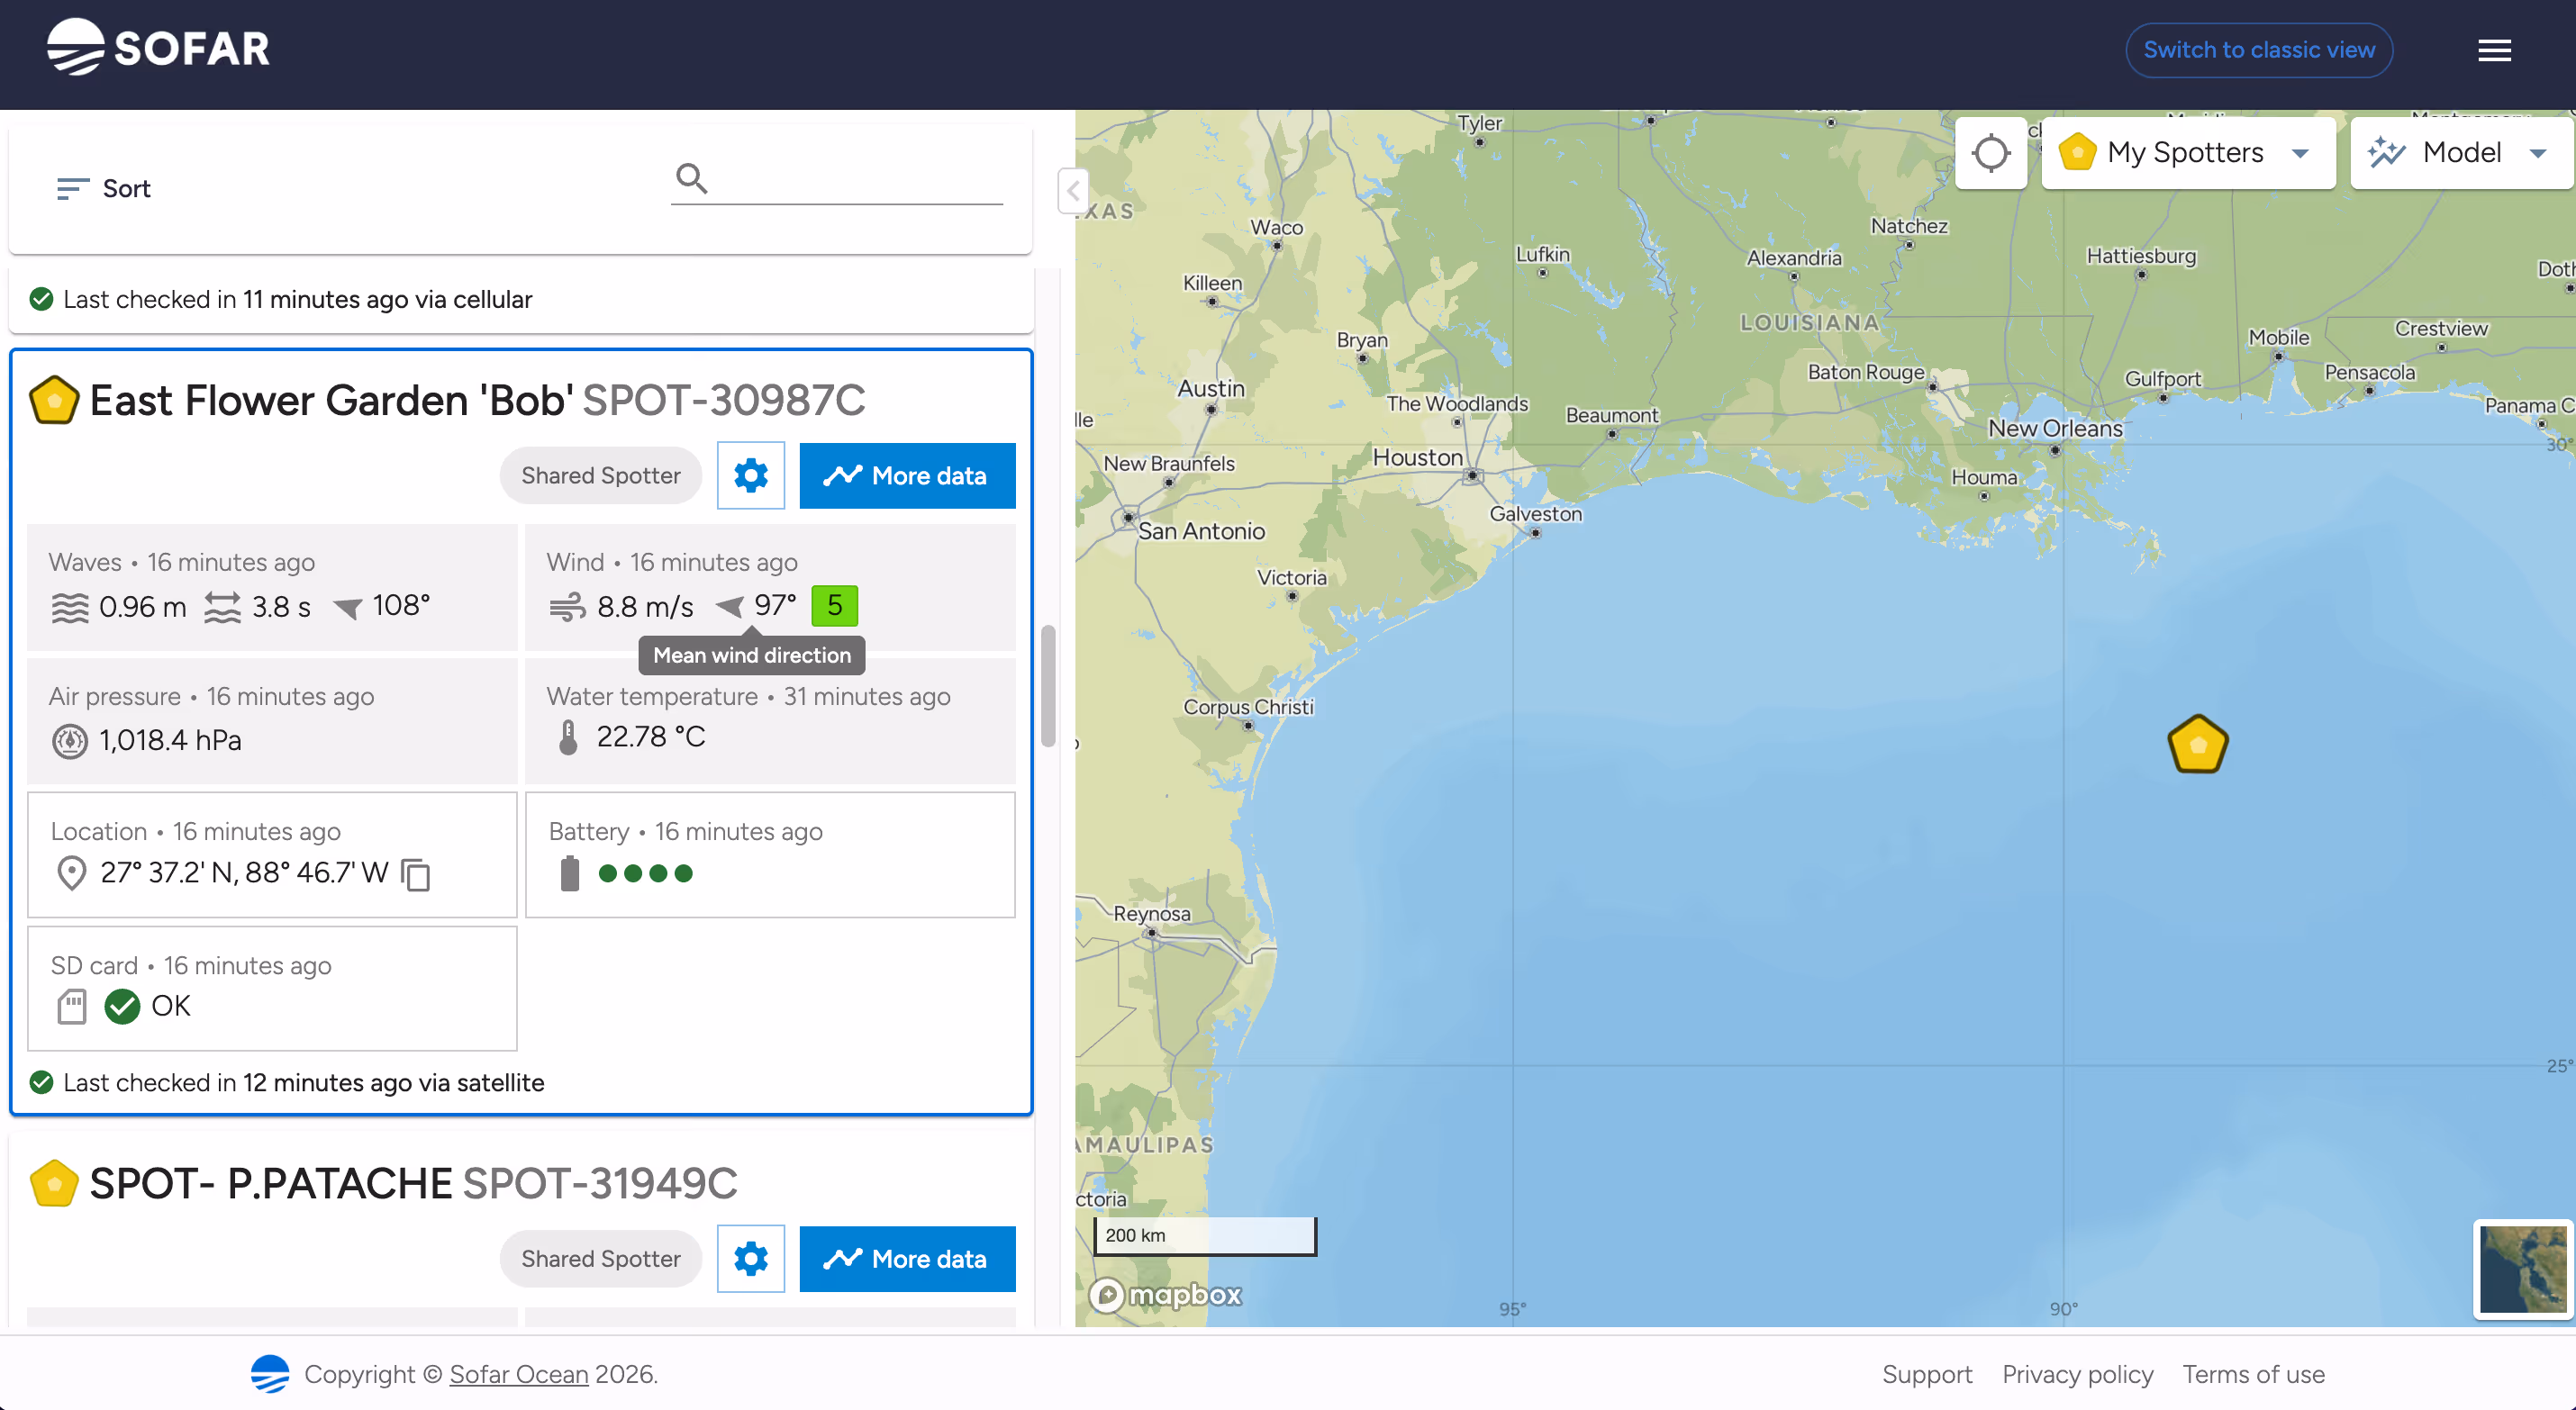
Our refreshed dashboard introduces an enhanced data exploration experience with clearer charts and more intuitive navigation. Key improvements include:
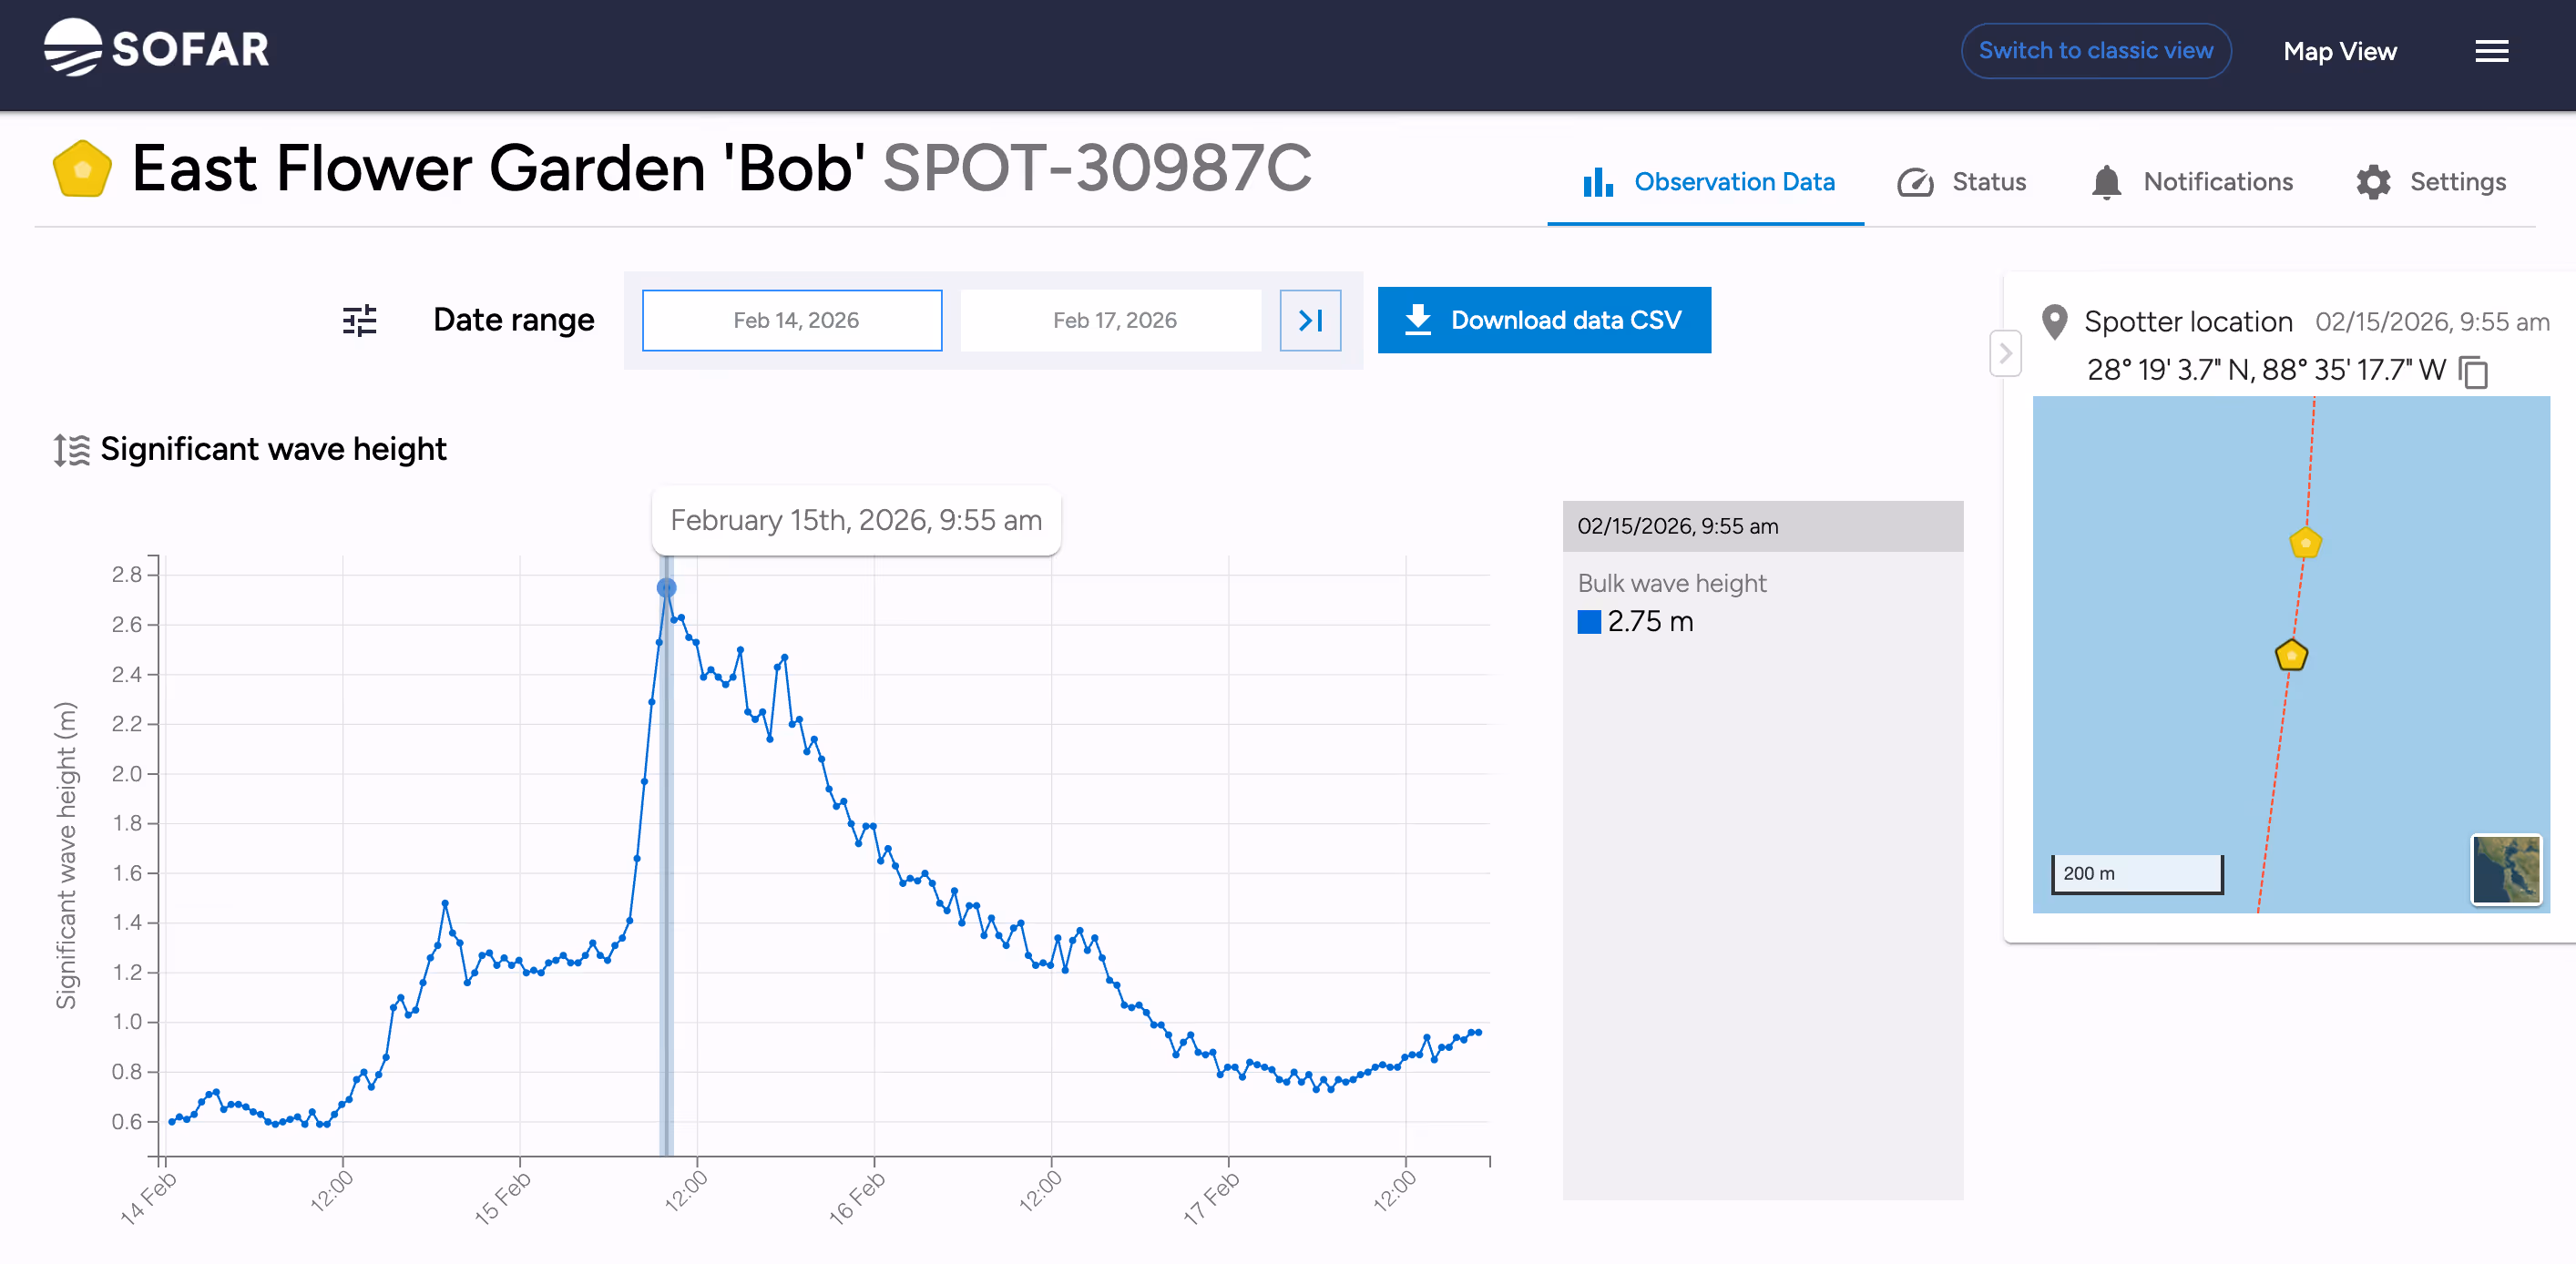
Real-time data charts with better readability and interactive controls for deeper analysis
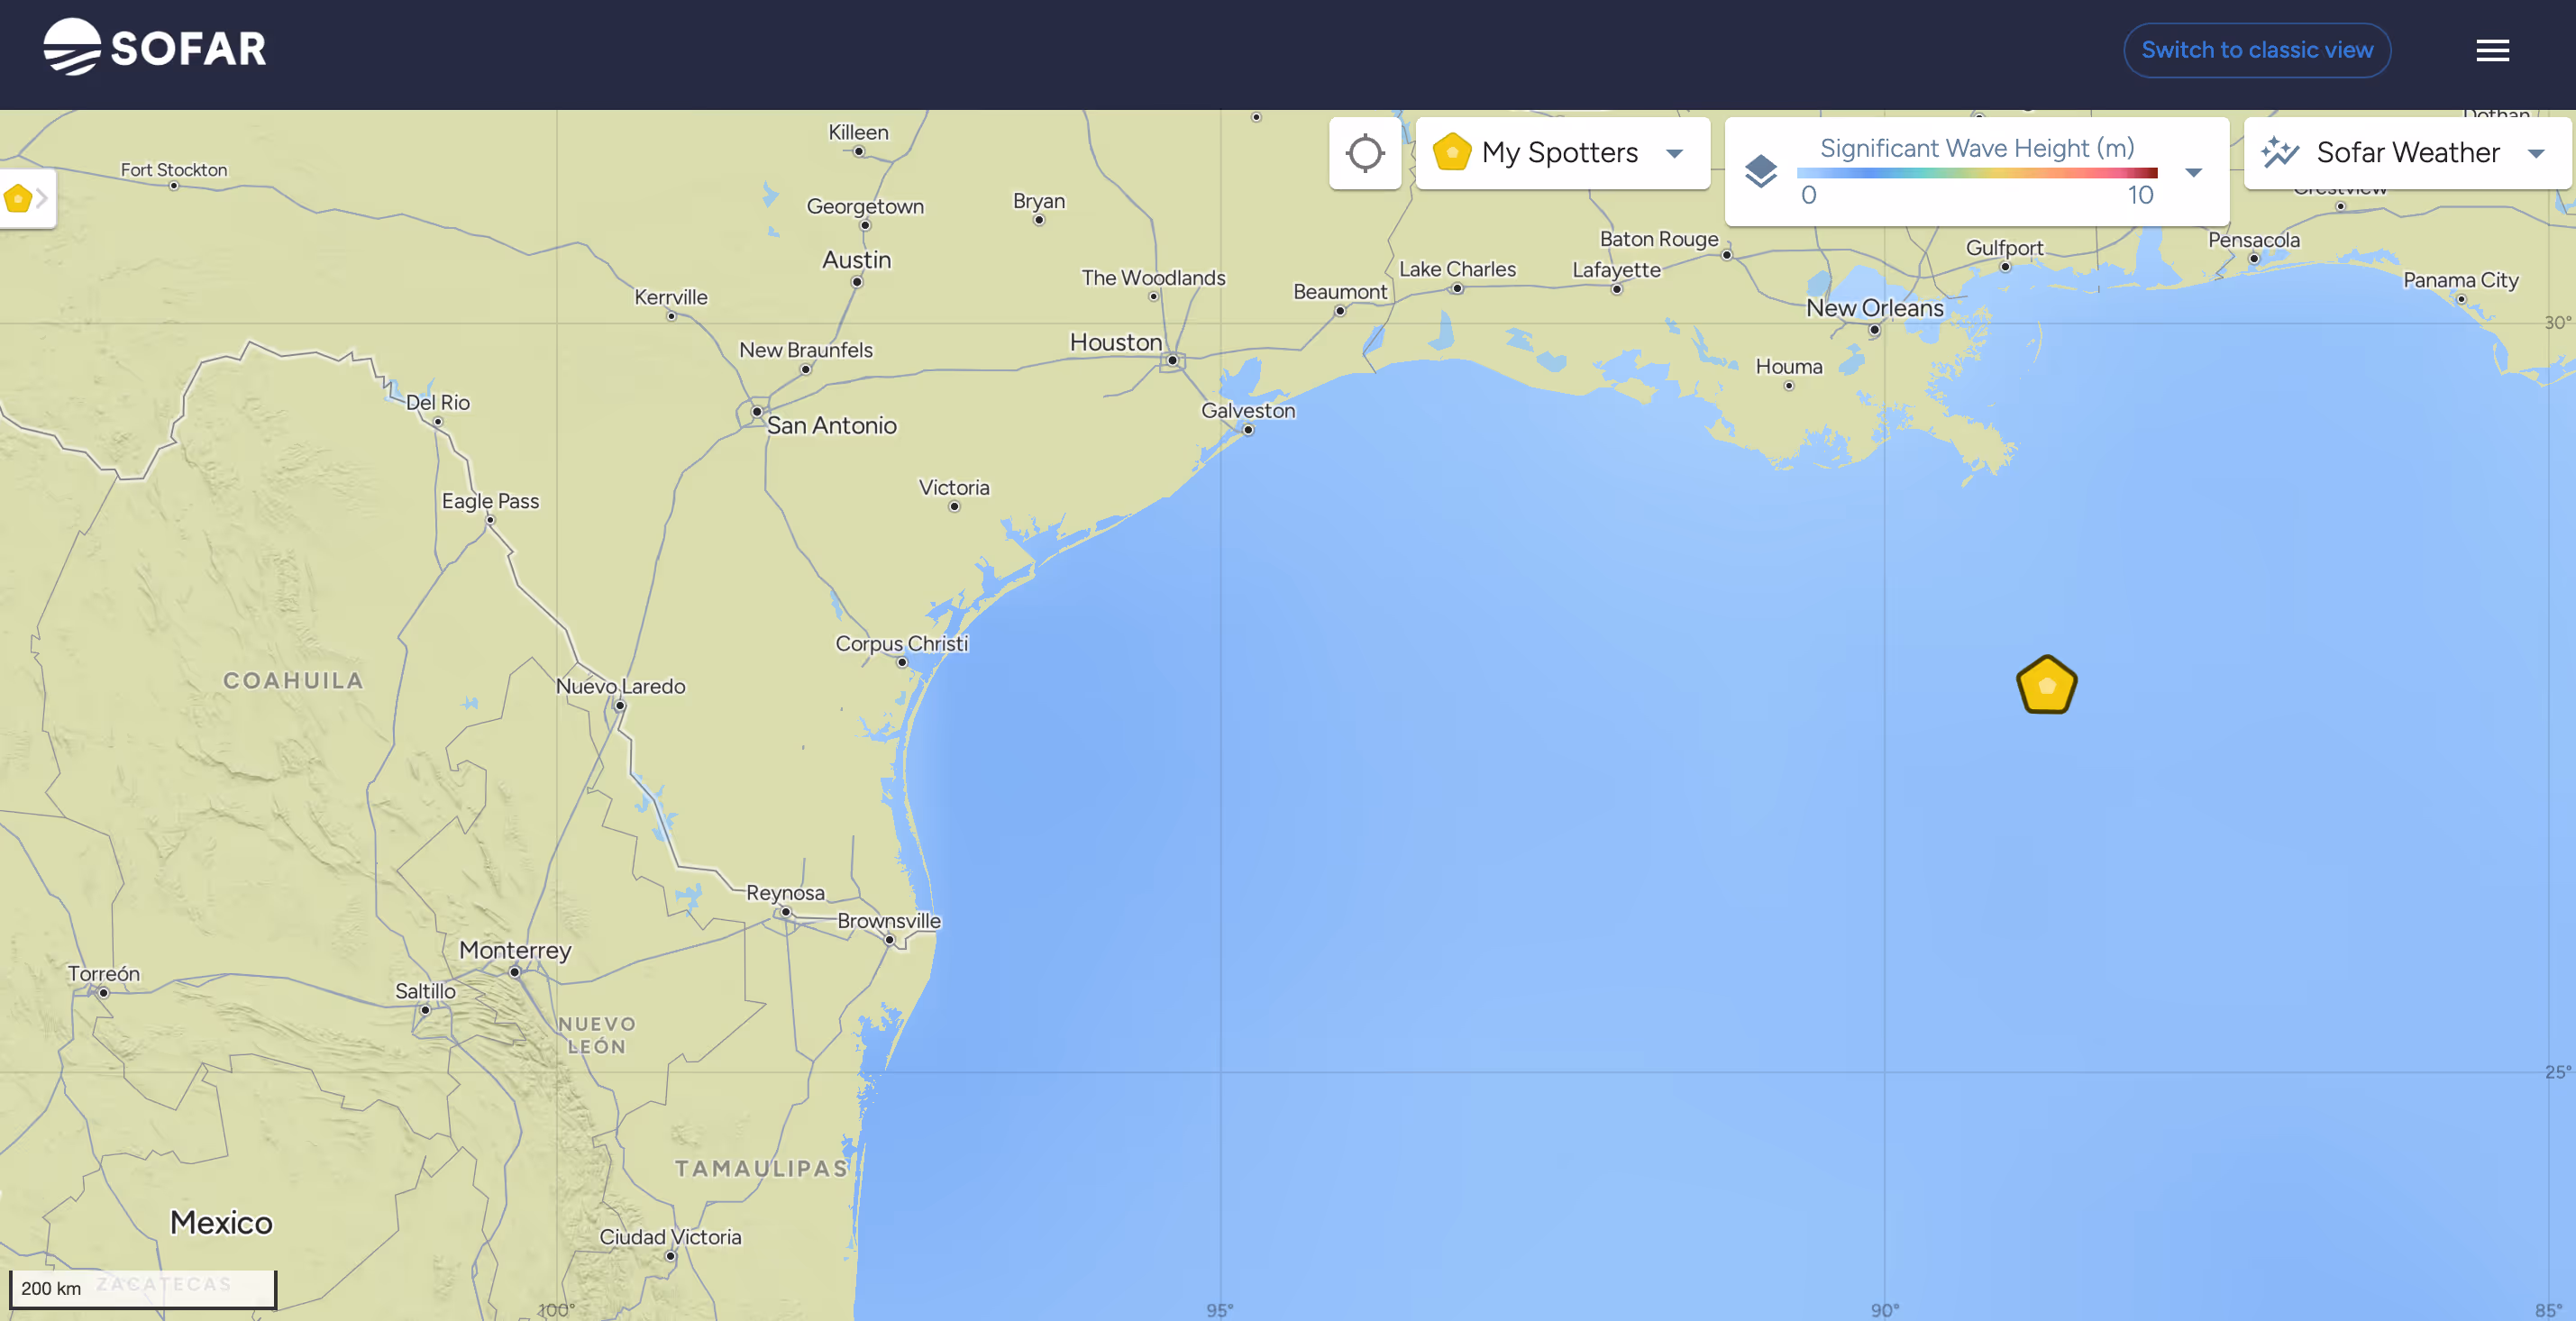
Enhanced map functionality, including synchronized breadcrumbs for historical observations and improved mini-maps to better correlate data with location
Expanded subsurface payload support, with new data streams for Oxygen, Salinity, and Acoustics alongside existing surface and subsurface colocated measurements
New data products — Wave Spectrum and Second-resolution Spectrogram offer rich visualizations of collected data for more precise decisioning
Mobile-compatibility
Shareable links for collaboration. You can now generate deep links to specific data views and time ranges, a feature that is especially useful for research, reporting, and operational reviews.
These updates make it easier to interpret trends, explore historical context, and work with more complex data sets.
The Spotter Dashboard's real-time, interactive data visualizations.
Clearer Device Management
Device status and health are now easier to understand at a glance. New and improved features include:
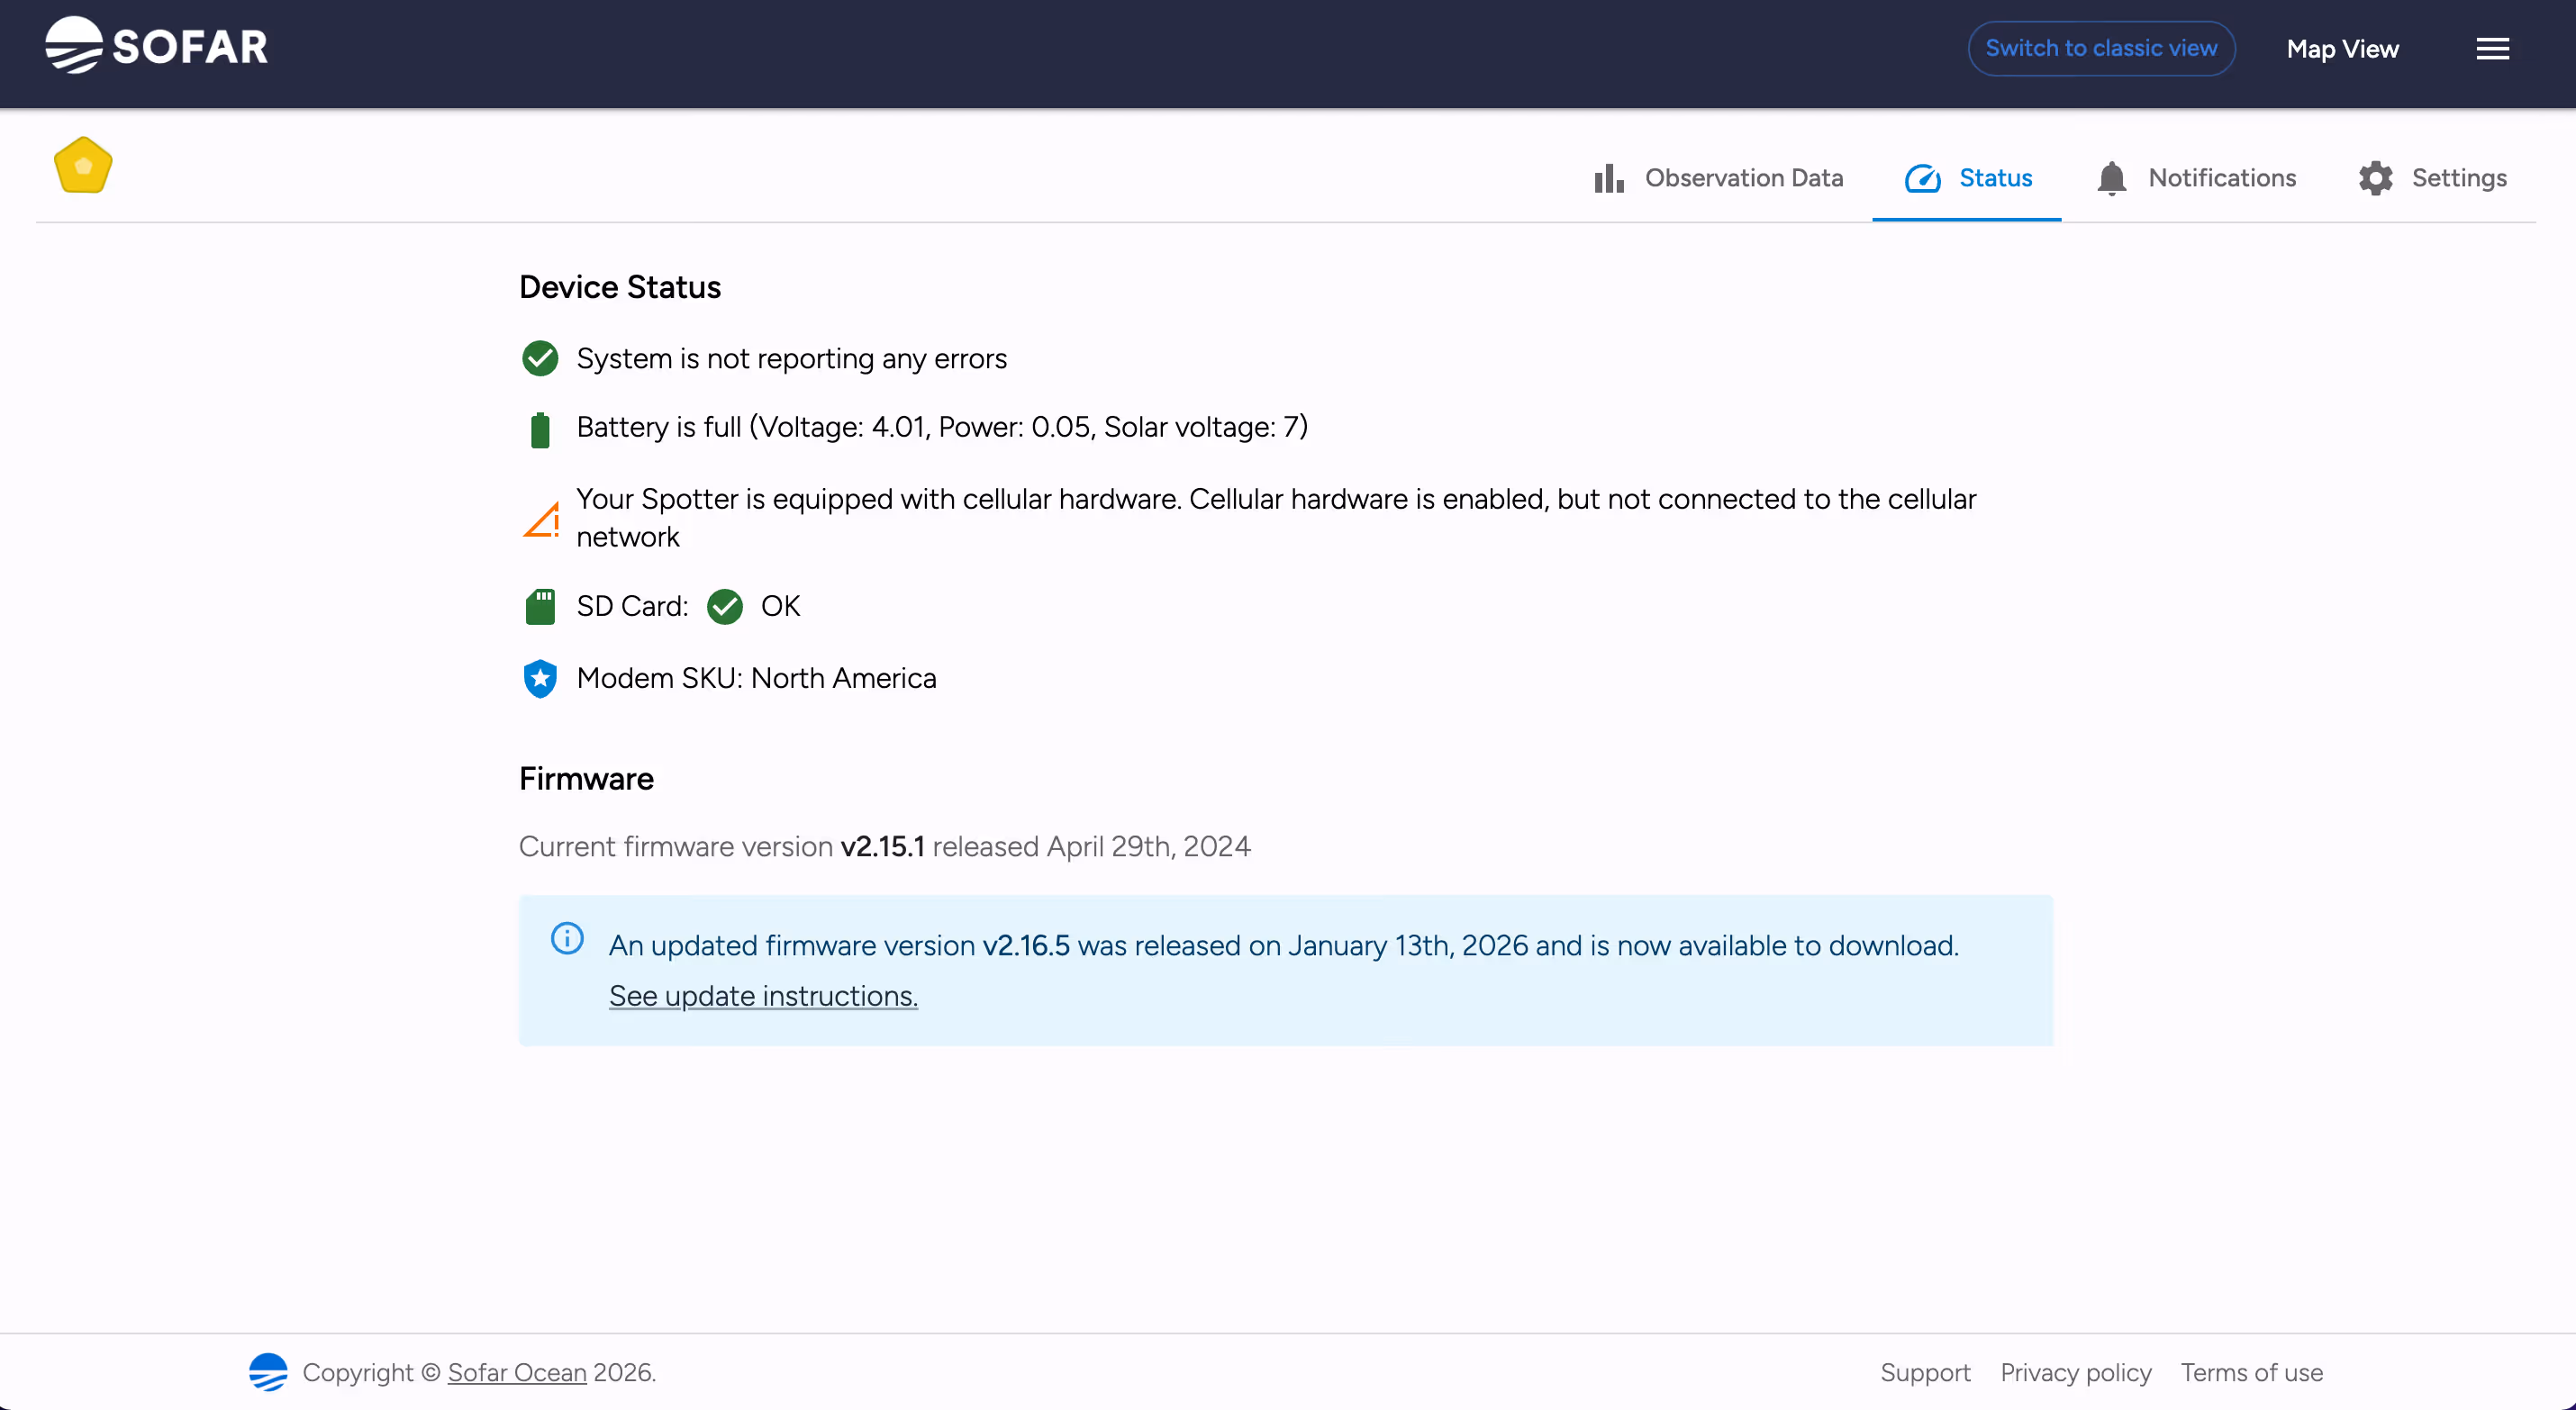
Device status indicators with clearer visual cues and messaging
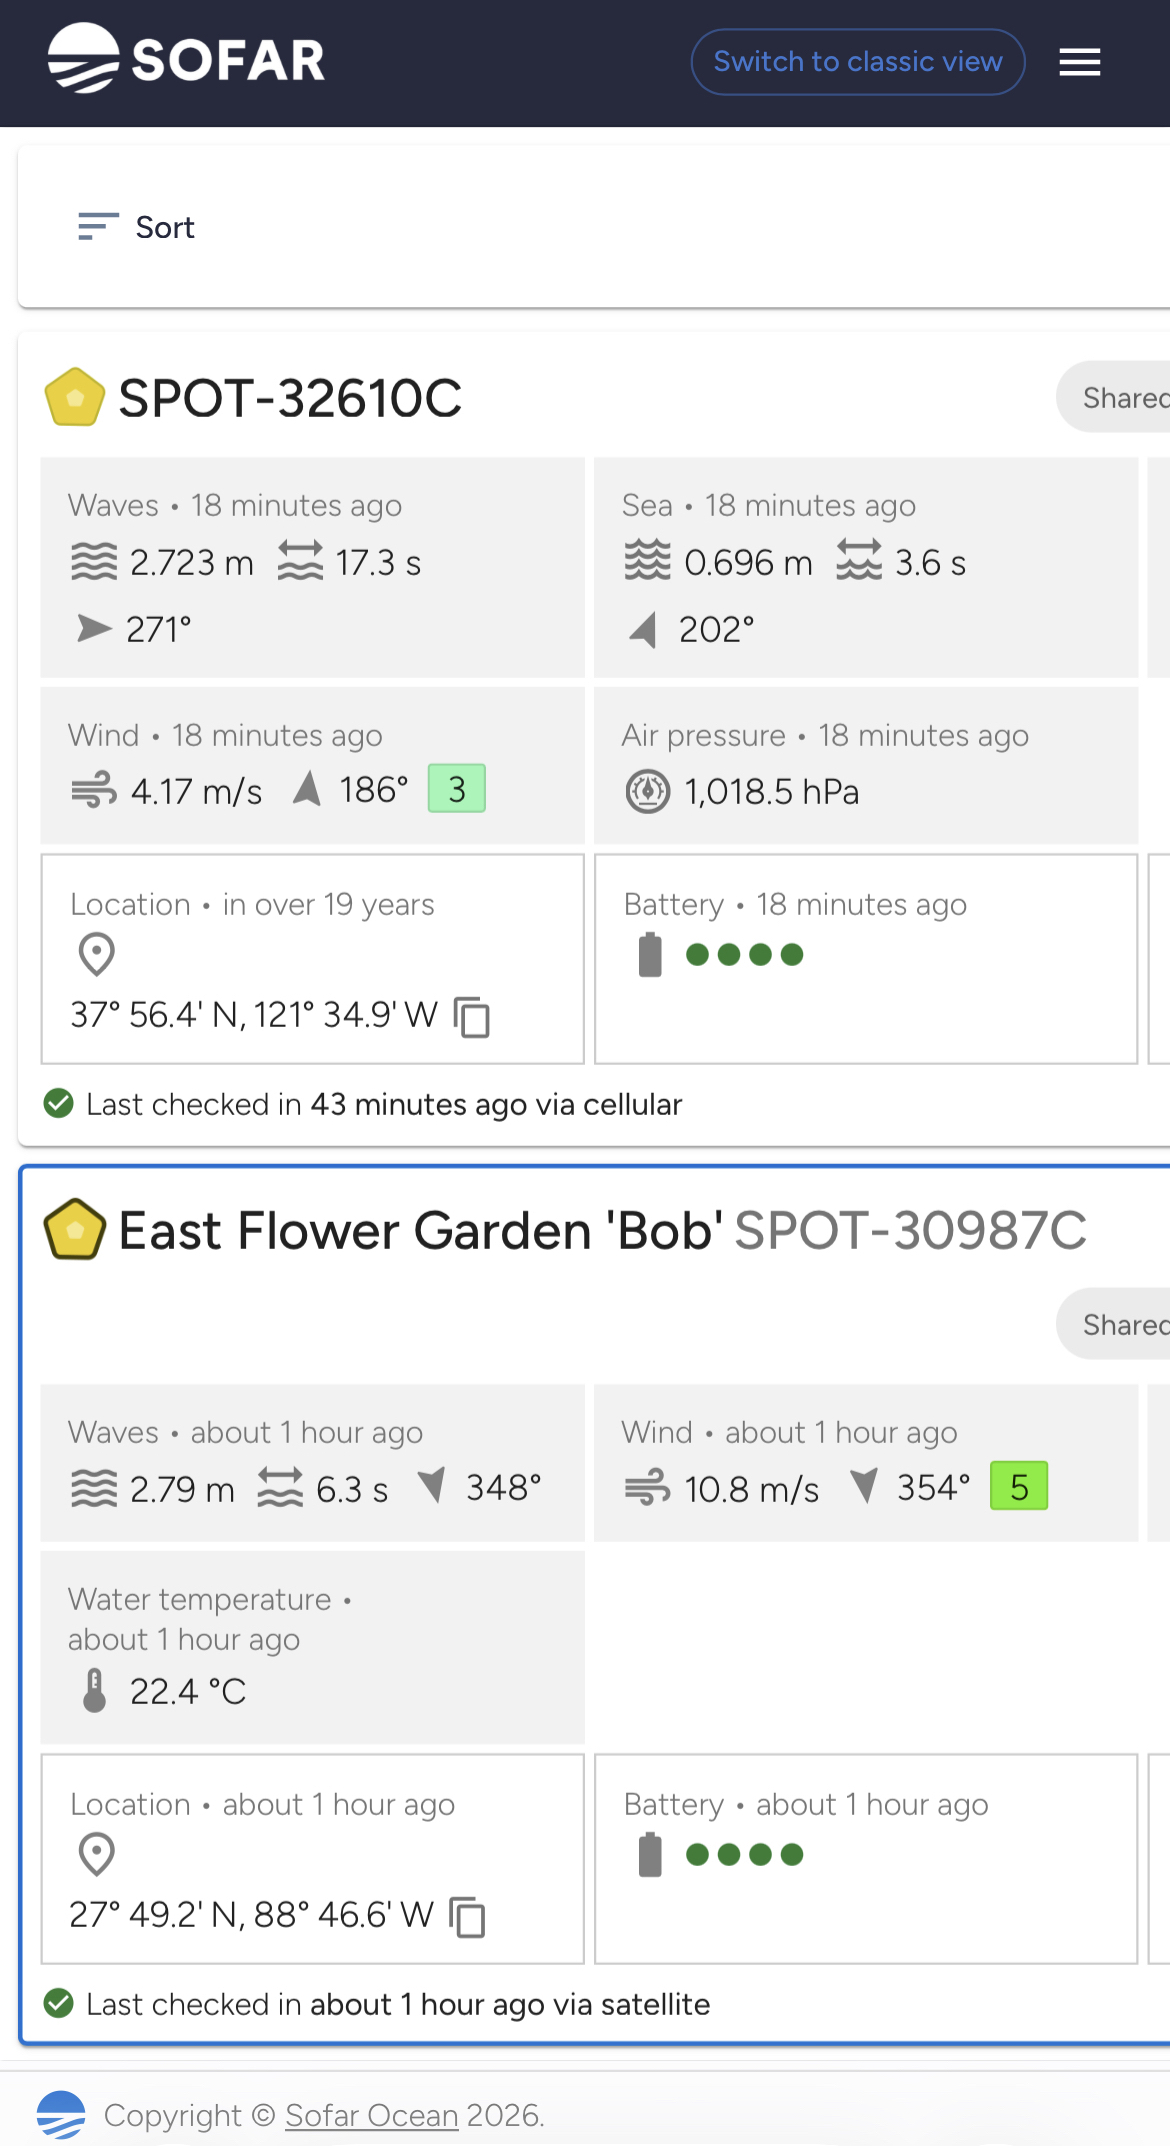
Redesigned device cards that surface relevant sensor information more efficiently
Improved alerts system with clearer naming and more useful default settings
Together, these changes reduce ambiguity and help teams quickly identify which devices need attention.
The Spotter Dashboard’s streamlined device status hub.
Performance & Reliability Improvements
The new dashboard addresses performance limitations seen in larger fleets. Notable improvements include:
Significantly faster load times, particularly for accounts with 100+ devices
A more responsive interface when navigating large data sets
Automatic data refresh — no more manually reloading pages
Improved usability on mobile and tablet devices, including shared device location for easier recovery
The Spotter Dashboard's mobile view.
Integrated Subscription & Billing Experience
The updated dashboard seamlessly integrates the latest Data Subscription updates, providing:
Clearer subscription and telemetry status per device
Expanded payment options, including ACH and bank transfer
Improved visibility into usage and costs across your account
The Spotter Dashboard’s redesigned interface.
What Did Not Change
Device sampling, logging, and transmission behavior
Data formats and APIs
Existing devices continue operating as configured
No action is required to maintain current workflows
Questions or Feedback
If you have questions about the new dashboard experience or feedback on what you’d like to see next, please reach out to support@sofarocean.com.
Log in to your Spotter Dashboard today to explore the updated experience.
Spotter Dashboard: 2026 Updates
February 19, 2026
A deep dive into the latest Spotter Dashboard updates, including a redesigned interface, expanded data visualization tools, and improved device management capabilities.
Related Stories
Product
January 16, 2026
What is sensor fusion and how does it help close the ocean data gap?
Events & Webinars
November 13, 2025
Webinar: From Data to Resilience – How ARII Uses the Spotter Platform to Protect Coastal Communities
Customer Stories
June 23, 2025
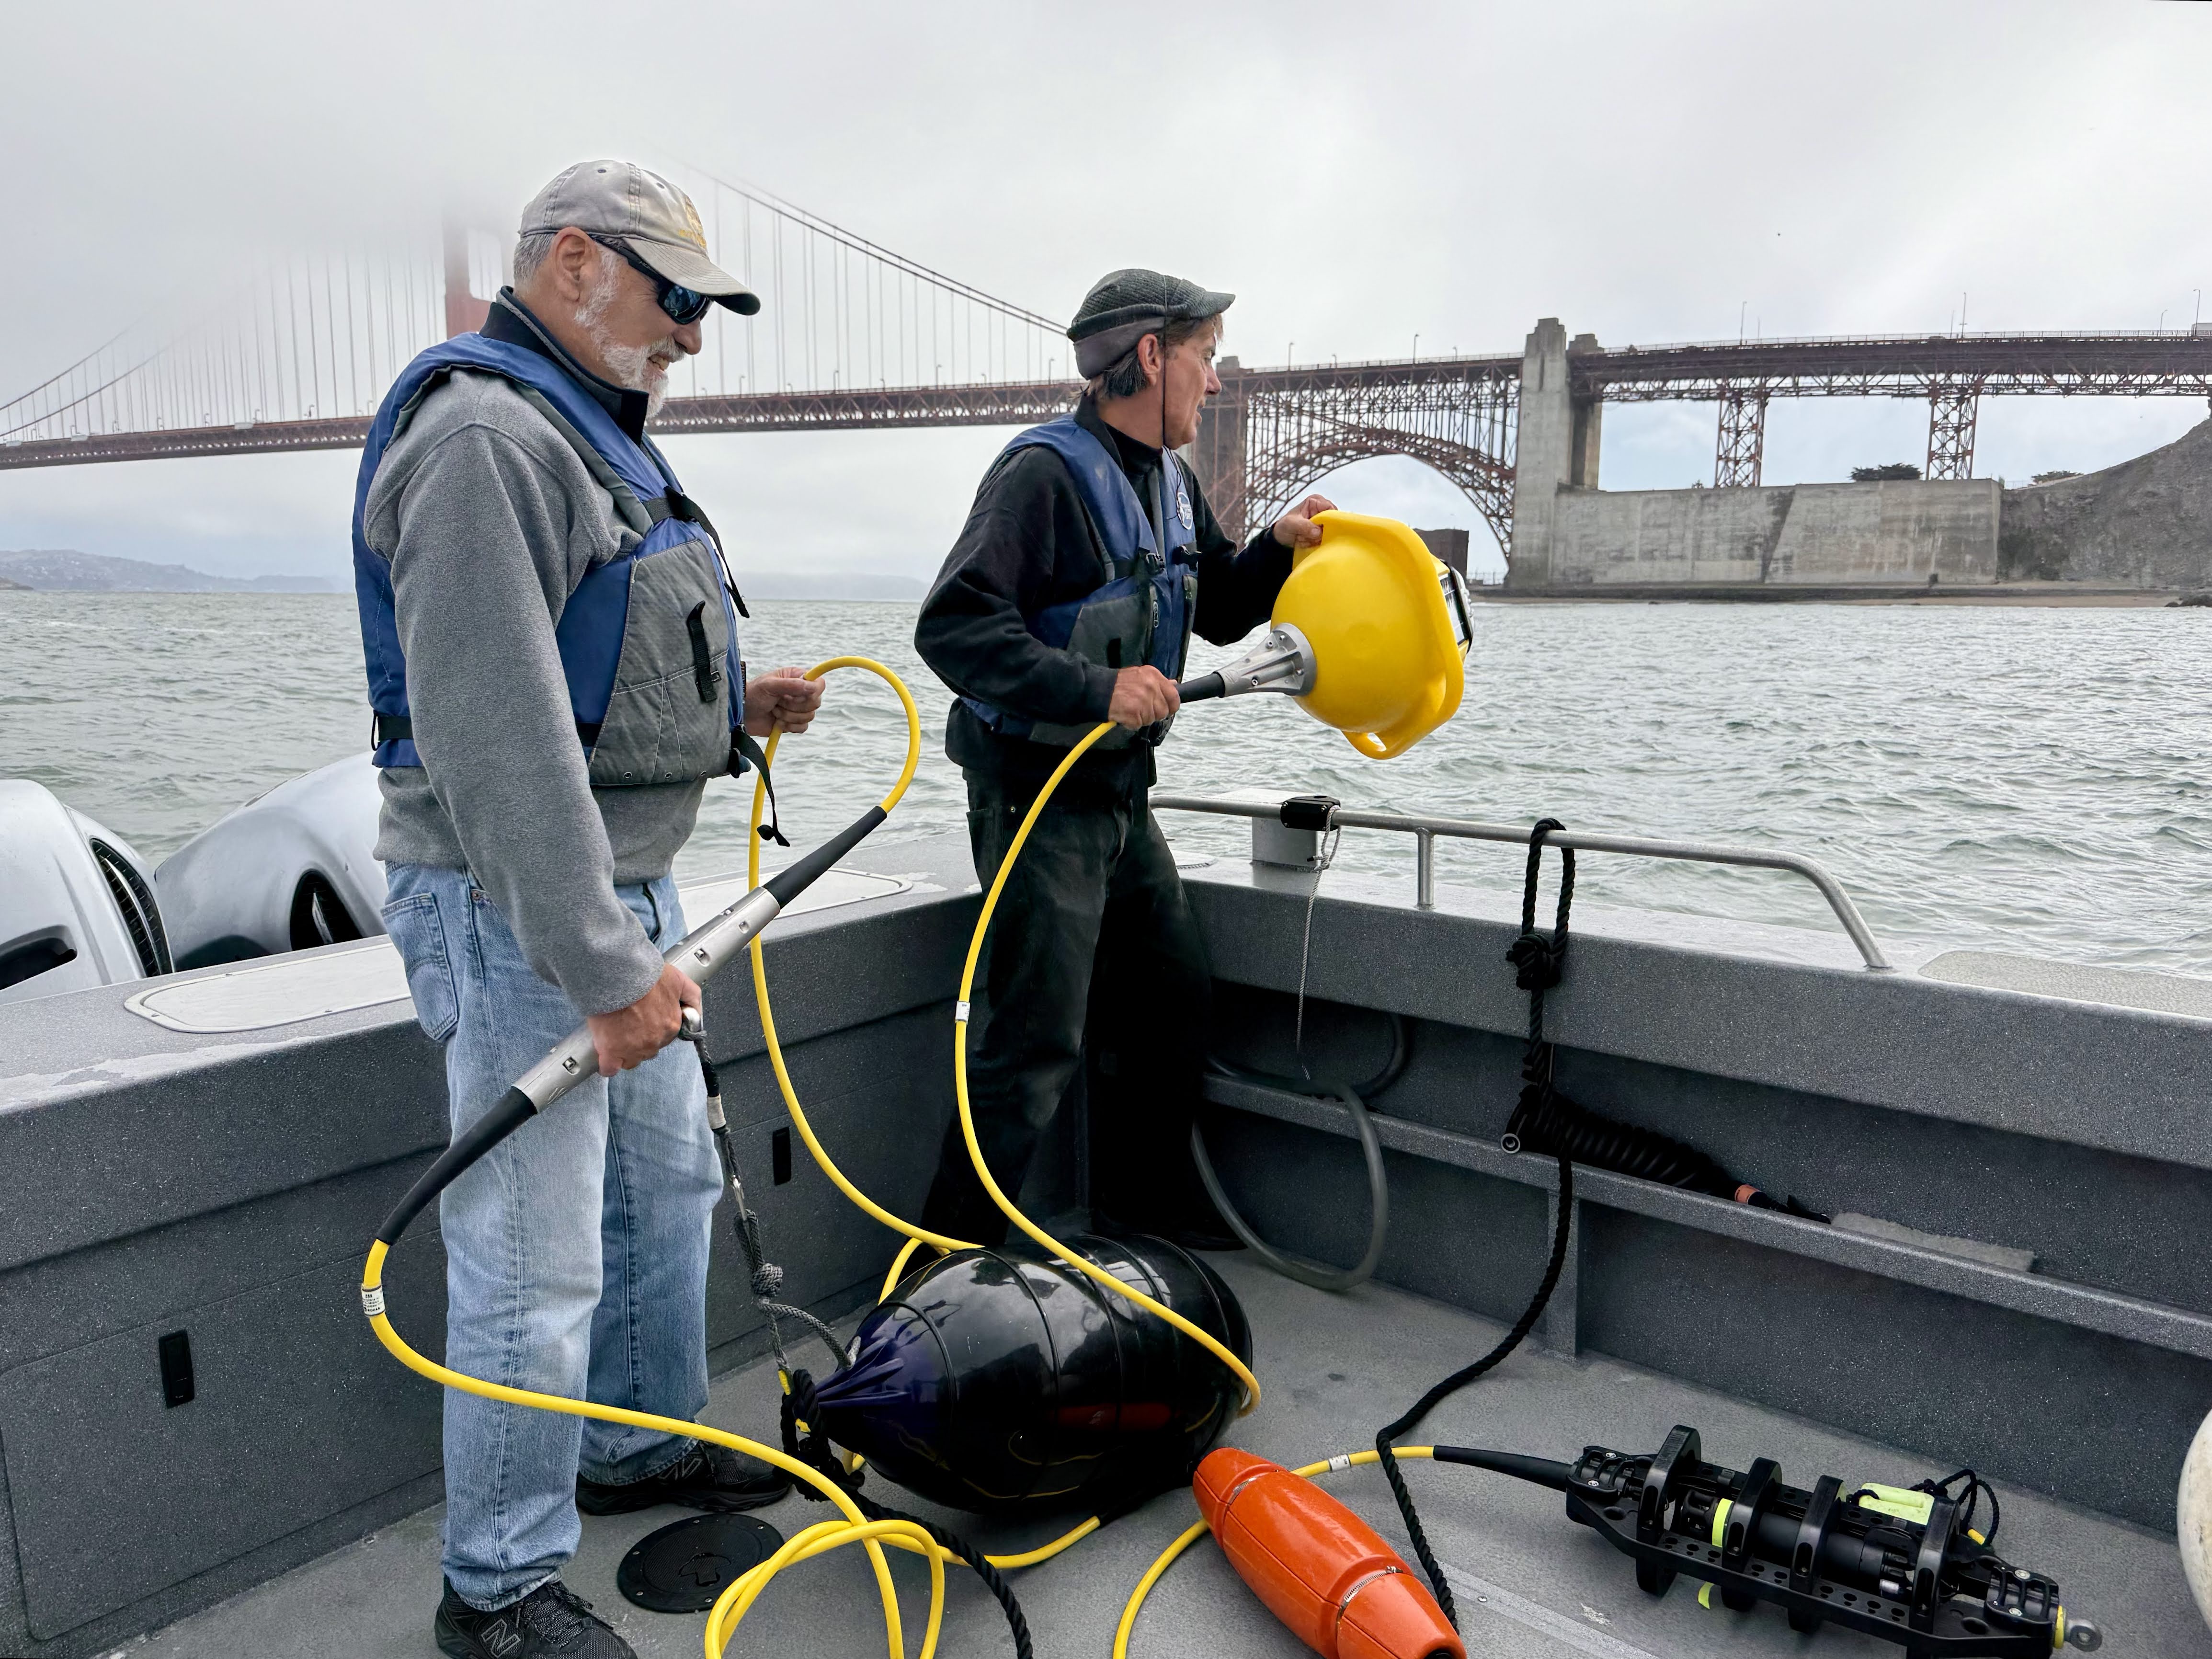
New Acoustic Monitoring Project Introduces Pioneering Blue Tech to Help Protect Humpback Whales Near San Francisco Bay
Sofar in the News
Ocean Science
July 6, 2026
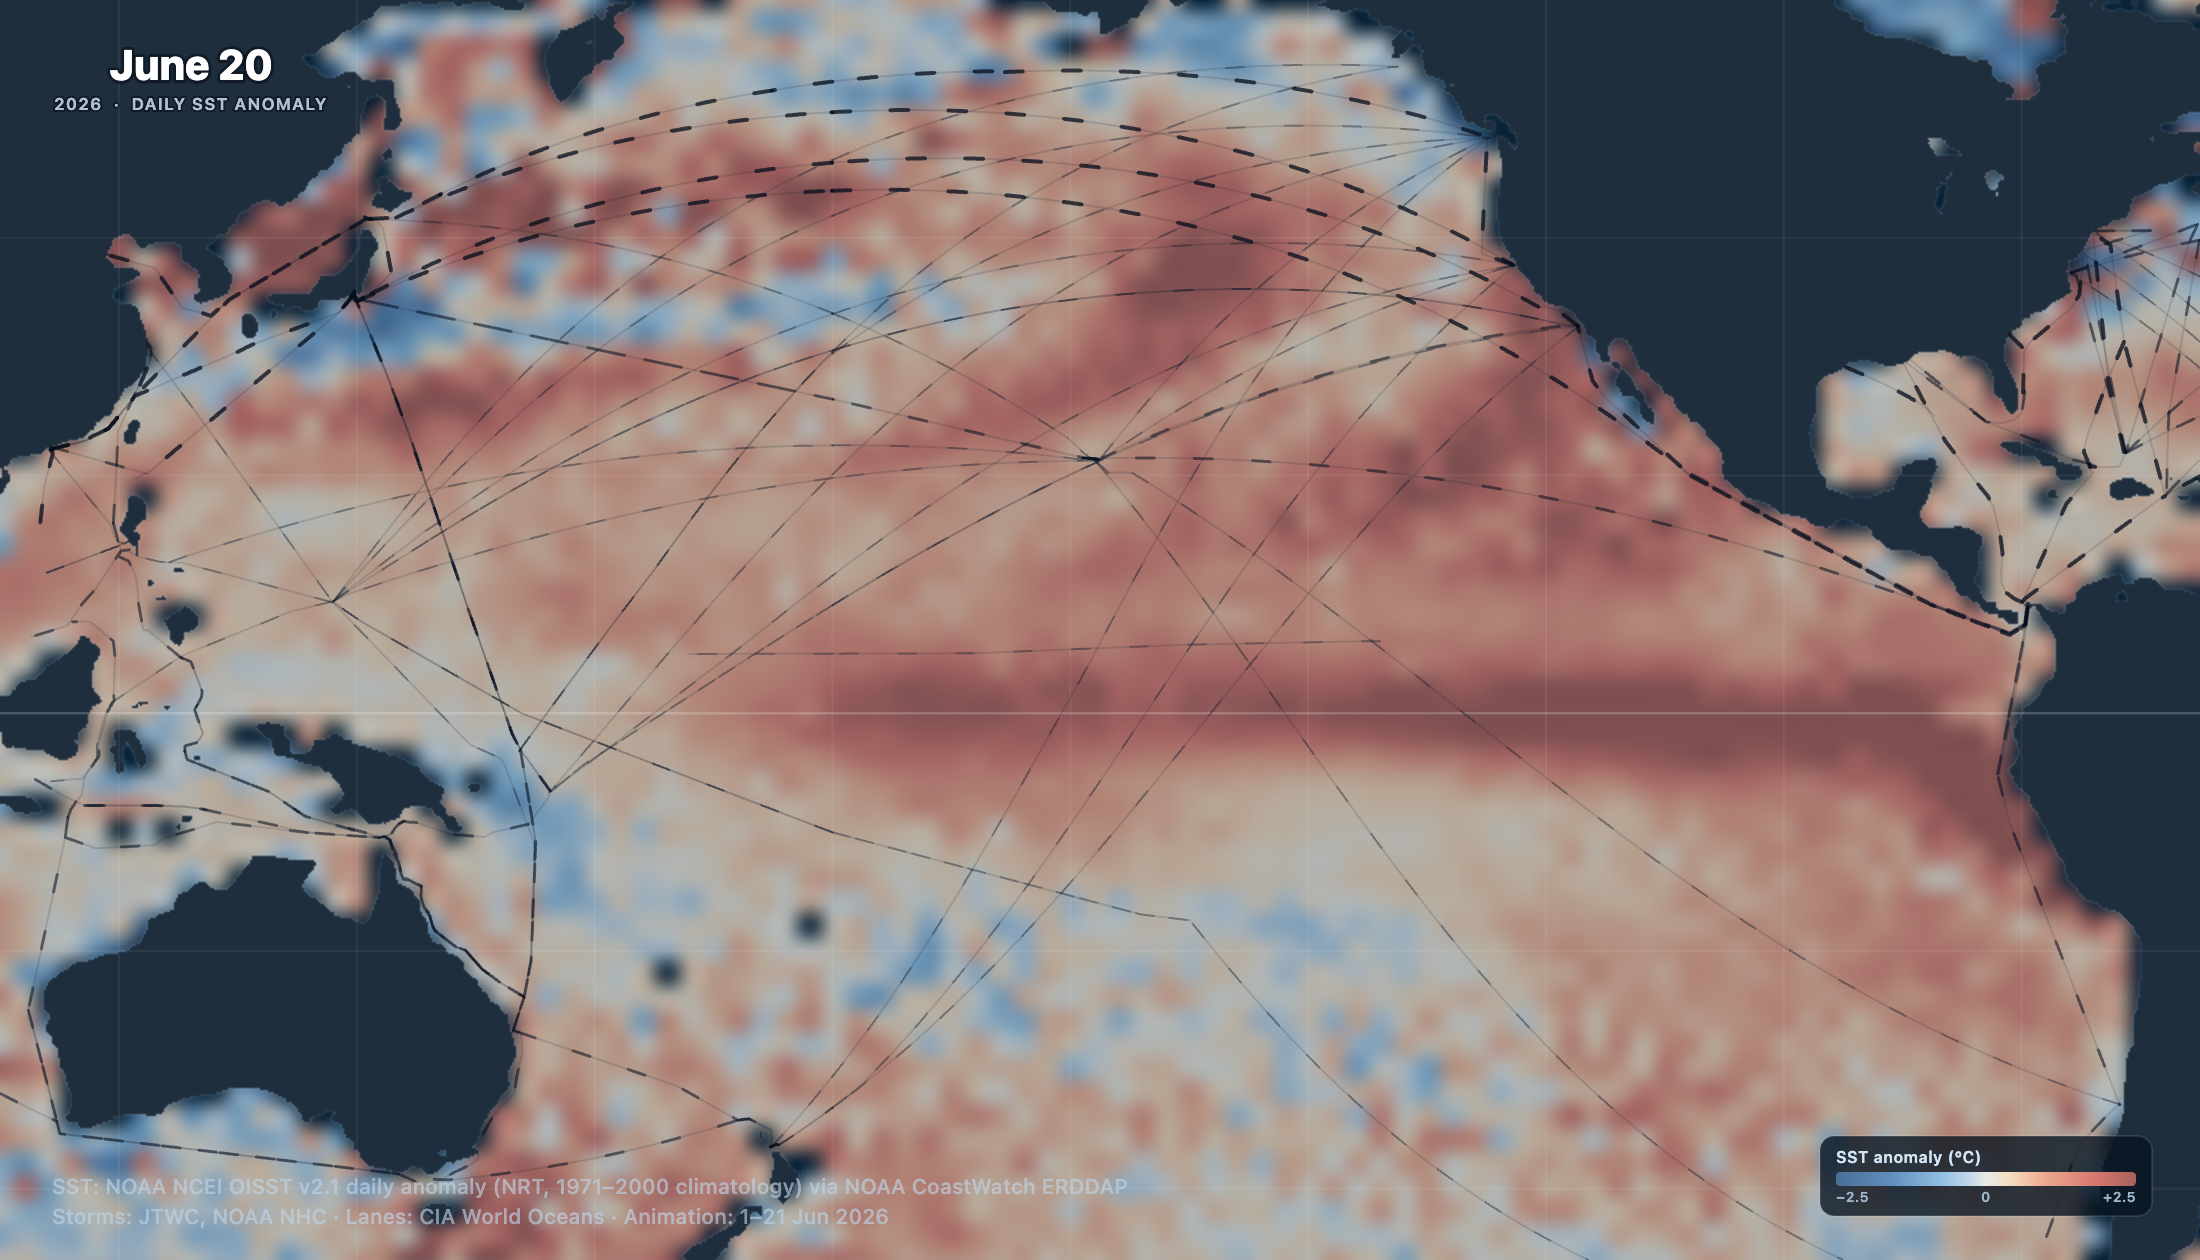
Extreme Weather, El Niño 2026
Product
June 23, 2026
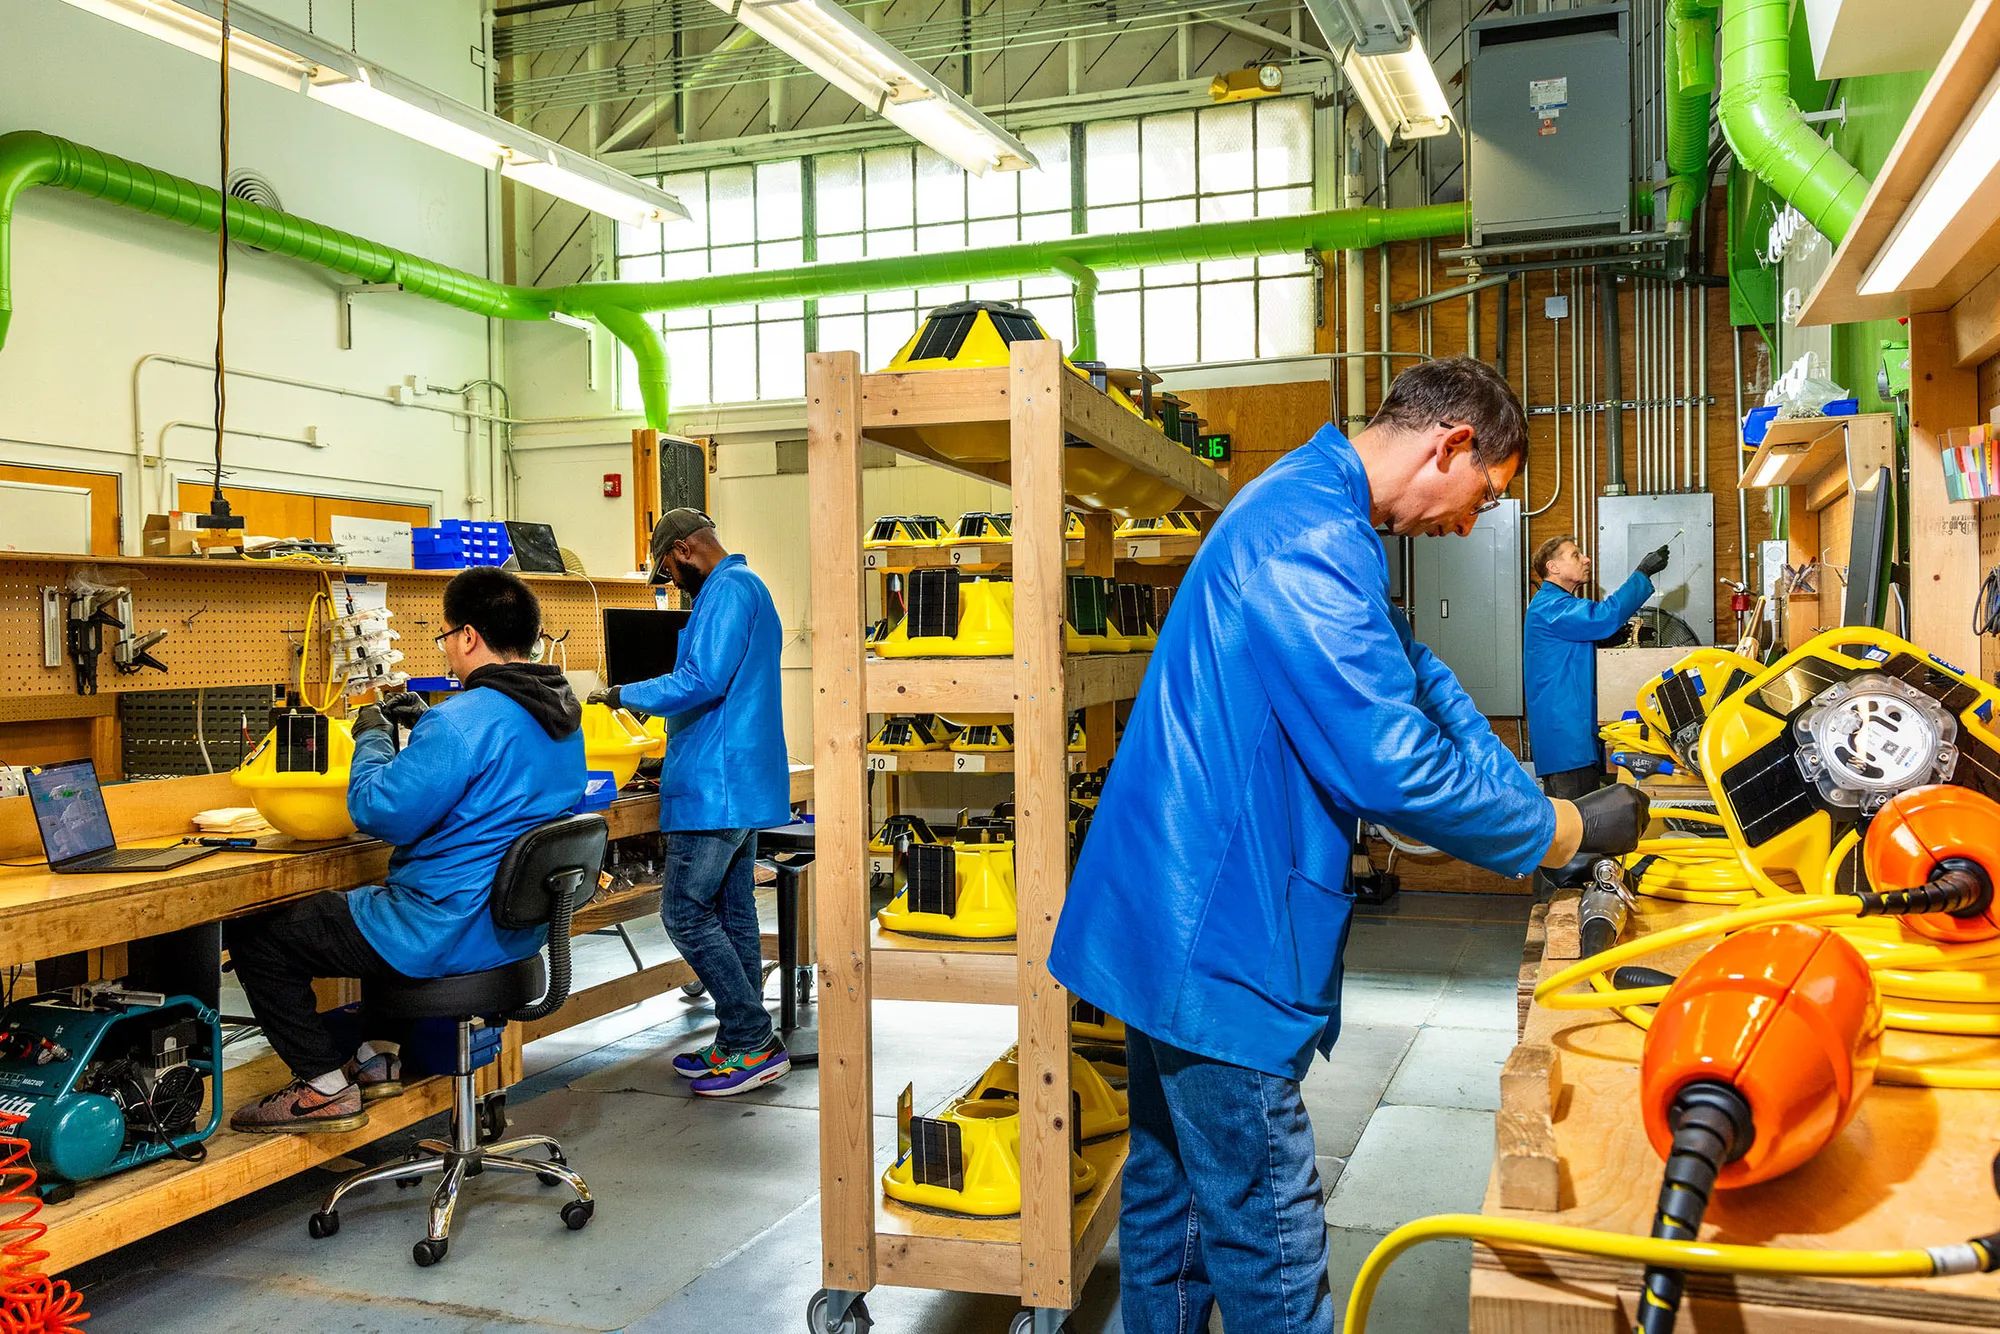
Dispatches from Spotter deployments in the world's most extreme ocean environments
Events & Webinars
June 17, 2026
Webinar: Through the Eye of a Super Typhoon: How Saipan's Community-Stewarded Spotter Network Is Reshaping Coastal Resilience