Creating an MPA is only the beginning. The real challenge starts the day after designation, when the work shifts from policy to operations.
Across the globe, MPA managers face a common set of obstacles that undermine even the best-intentioned protection efforts.
The core challanges
Big area, small resources
As of 2024, the world's marine protected areas covered roughly 30 million km².1 Managing that area requires patrol vessels, monitoring equipment, trained staff, data infrastructure, and sustained funding. Most MPAs have a fraction of what they need. Where the recommended staffing density for a terrestrial park is roughly one ranger per 26 km², an MPA officer can be responsible for thousands of square kilometers of open water with no natural boundaries and limited visibility.2

of the world's Marine Protected Areas reported inadequate budget, and 91% lacked sufficient staff, undermining capacity for basic management activities like monitoring and enforcement.³
Funding makes it structural. MPA budgets typically depend on government allocations that shift with political cycles, grants with time limits and reporting burdens, or tourism revenue that can vanish overnight. The result is permanent conservation mandates funded by temporary money.4
The evidence gap
MPA managers don't just need to do conservation. They need to prove it's working. Funders want impact metrics. Governments want compliance reports. Communities want tangible benefits. Every stakeholder has a different evidentiary standard, and most MPAs struggle to meet any of them consistently.
of MPA designations in one of the world's most well-resourced marine regions lacked any baseline or monitoring studies. Ecological events like bleaching, illegal fishing, or pollution can occur and resolve entirely between surveys, leaving no data trail.5,6
We know the reef is healthier than it was five years ago. We can see it when we dive. But 'we can see it' doesn't hold up in a funding report.
Most MPAs have no systematic monitoring at all. Those that do typically rely on periodic field surveys conducted once or twice a year.5 These provide snapshots, not trends. They capture conditions on the day of the survey, not the 364 other days. And they generate data that can take months to process, by which point decisions have already been made on instinct rather than evidence.
The paper parks crisis
A “paper park” is a protected area that exists legally but delivers little conservation benefit. A boundary on a map without enforcement behind it. Fewer than one-quarter of the world's protected areas report adequate resources in staffing and budget for effective management.7 For marine sites, the picture is often worse.
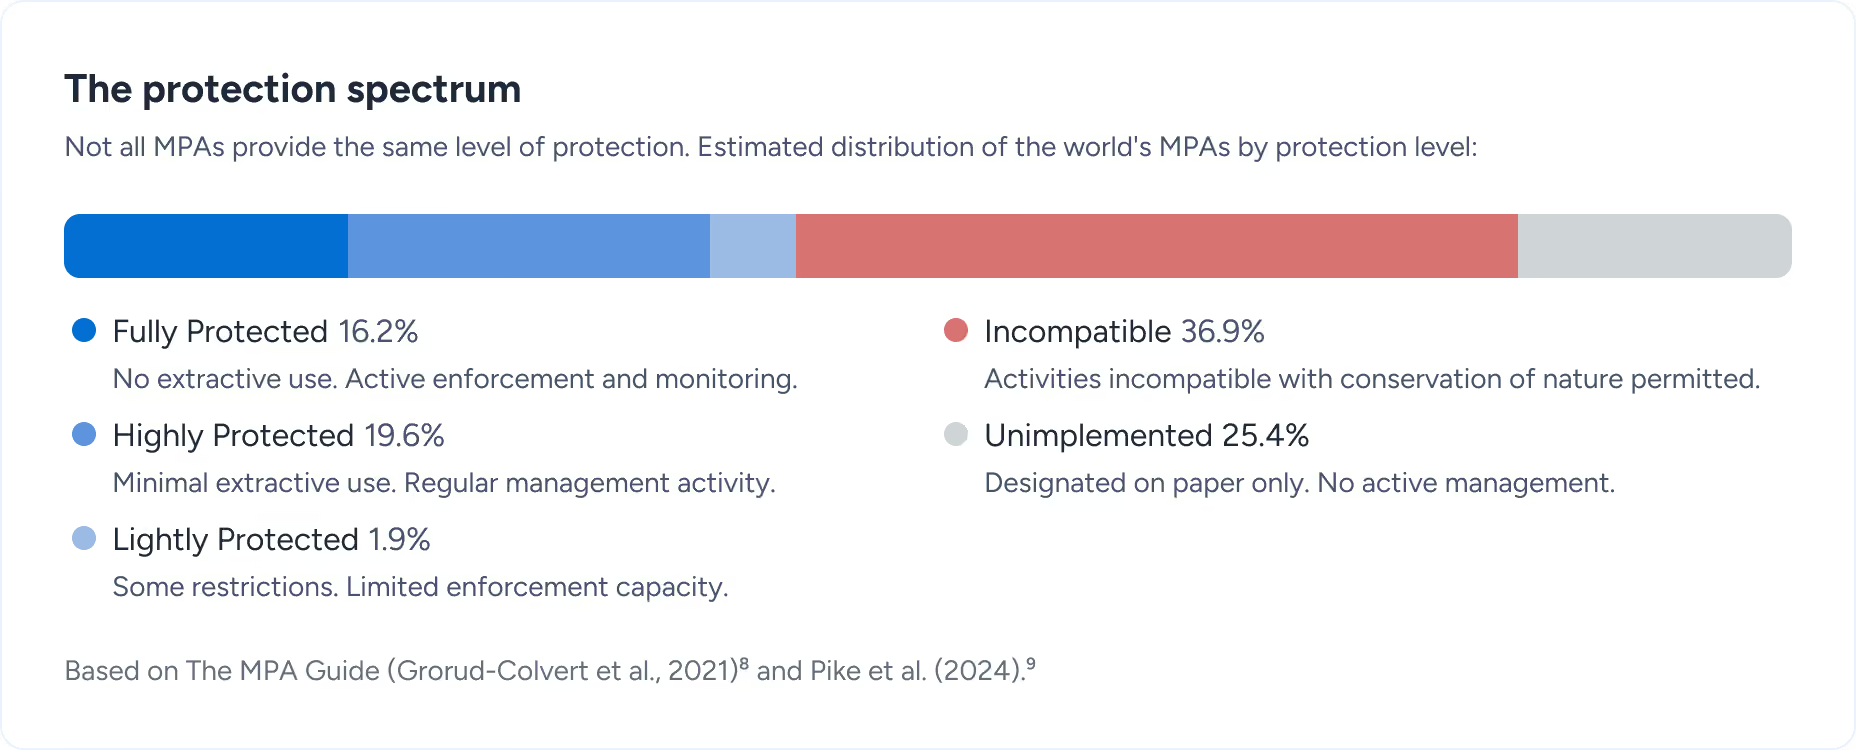
When nations report progress toward conservation targets, they count all designated MPAs equally. A fully managed marine reserve counts the same as a vast designation with no management activity.10 This creates a perverse incentive: it's politically easier to designate large ocean areas as protected than to invest in making existing MPAs work.
These challenges are connected
The scale problem, the evidence gap, and the paper parks crisis reinforce each other. Limited resources mean less monitoring. Less monitoring means less evidence. Less evidence means less funding. Less funding means the scale problem persists.
Limited resources
Most MPAs operate with a fraction of the stuff, equipment, budget needed for their vast coverage areas.
Insufficient monitoring
Without adequate resources, managers can’t maintain continuous observation of what’s happening across their sites.
Funding shortfalls
Without defensible evidence of impact, it’s difficult to justify continued investment or secure new support.
Weak evidence
Sporadic monitoring produces snapshots, not trends. The data does’n meet the standards funders and regulators require.
1. UNEP-WCMC and IUCN (2024). Protected Planet Report 2024. Cambridge, UK: UNEP-WCMC; Gland, Switzerland: IUCN
2. Appleton, M.R., Courtiol, A., Emerton, L., et al. (2022). Protected area personnel and ranger numbers are insufficient to deliver global expectations. Nature Sustainability, 5, 1100–1110. DOI: 10.1038/s41893-022-00970-0
3. Gill, D.A., Mascia, M.B., Ahmadia, G.N., et al. (2017). Capacity shortfalls hinder the performance of marine protected areas globally. Nature, 543(7647), 665–669. DOI: 10.1038/nature21708
4. Emerton, L., Bishop, J., & Thomas, L. (2006). Sustainable Financing of Protected Areas: A global review of challenges and options. IUCN Best Practice Protected Area Guidelines Series No. 13; Balmford, A., et al. (2004). The worldwide costs of marine protected areas. PNAS, 101(26), 9694–9697. DOI: 10.1073/pnas.0403239101
5. Giakoumi, S., Hogg, K., Di Lorenzo, M., et al. (2024). Deficiencies in monitoring practices of marine protected areas in southern European seas. Journal of Environmental Management.
6. Qin, Z., et al. (2024). Optimization of thermal stress thresholds on regional coral bleaching monitoring by satellite measurements of sea surface temperature. Frontiers in Marine Science, 11, 1438087. DOI: 10.3389/fmars.2024.1438087
7. Coad, L., Watson, J.E.M., Geldmann, J., et al. (2019). Widespread shortfalls in protected area resourcing undermine efforts to conserve biodiversity. Frontiers in Ecology and the Environment, 17(5), 259–264. DOI: 10.1002/fee.2042
8. Grorud-Colvert, K., Sullivan-Stack, J., Roberts, C., et al. (2021). The MPA Guide: A framework to achieve global goals for the ocean. Science, 373(6560), eabf0861. DOI: 10.1126/science.abf0861
9. Pike, E.P., MacCarthy, J.M.C., Hameed, S.O., et al. (2024). Ocean protection quality is lagging behind quantity: Applying a scientific framework to assess real marine protected area progress against the 30 by 30 target. Conservation Letters, e13020. DOI: 10.1111/conl.13020
10. Sala, E., Lubchenco, J., Grorud-Colvert, K., et al. (2018). Assessing real progress towards effective ocean protection. Marine Policy, 91, 11–13. DOI: 10.1016/j.marpol.2018.02.004
11. Convention on Biological Diversity (2022). Kunming-Montreal Global Biodiversity Framework (Decision CBD/COP/DEC/15/4). Target 3.
12. UNEP-WCMC and IUCN (2024). Protected Planet Report 2024 (8.4% marine coverage); Pike, E.P., et al. (2024). Conservation Letters, e13020 (8.2% from Feb 2023 WDPA data; only ~one-third of assessed MPA area fully or highly protected).