MPA managers are not short of monitoring tools. Satellites photograph the surface, transponders track vessels, hydrophones listen for whales, and divers count fish on transects. The technology exists.
The problem is that each tool carries real constraints, and the data they produce rarely talks to each other. This chapter surveys what is available today, what each approach can and cannot do, and where the gaps persist.
Remote sensing and vessel tracking
The sheer scale of marine environments makes physical surveillance impossible for most agencies. Satellites, electronic transponders, and aerial platforms have become the core infrastructure of maritime domain awareness. But these tools operate in a landscape of “too much and too little”: an explosion of raw data, paired with persistent blind spots in resolution, timing, and coverage.
Satellite imagery: optical vs. radar
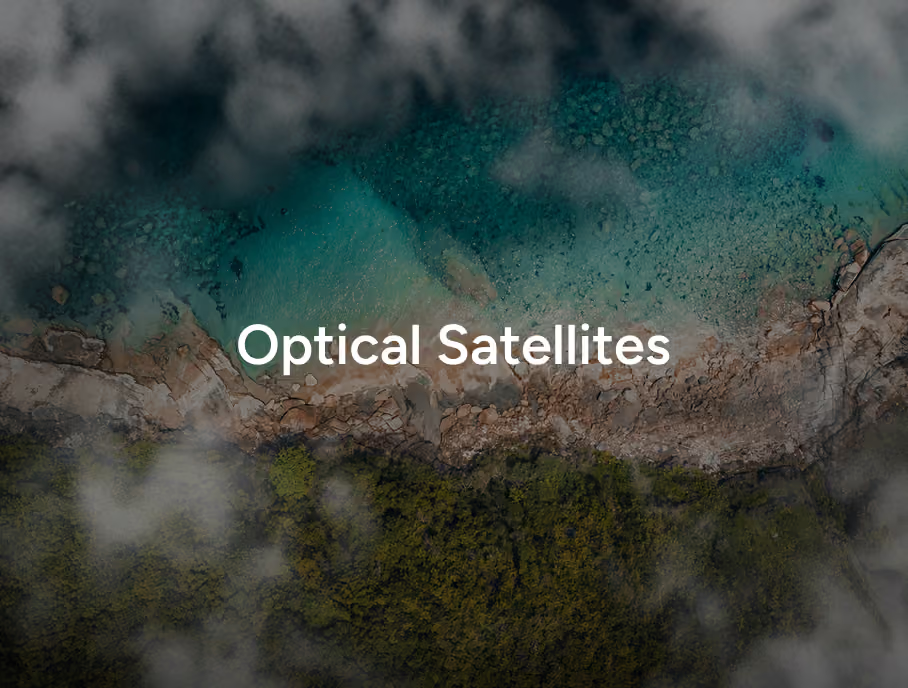
Optical satellites rely on sunlight and are the primary tool for mapping benthic habitats, measuring chlorophyll-a and turbidity, and detecting nearshore infrastructure. Modern high-resolution systems such as Maxar's WorldView-3 can achieve 0.3-meter resolution, allowing managers to identify specific vessel types and fine-scale coral bleaching patterns.
Optical sensors cannot see through clouds and operate only in daylight. In tropical MPAs, where cloud cover exceeds 70% of the year¹ this means usable images may arrive only a few times per month.
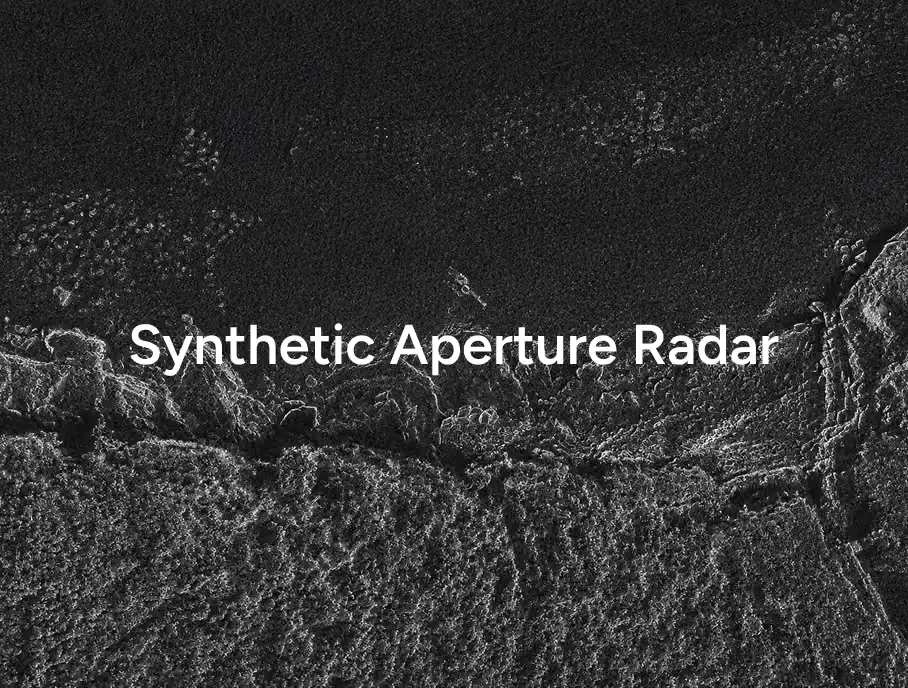
Synthetic Aperture Radar (SAR) overcomes these limitations by emitting microwave pulses that penetrate clouds, smoke, and darkness. It provides true 24/7, all-weather monitoring and is exceptionally effective at detecting "dark vessels" that have switched off their transponders.
SAR cannot measure water quality or identify marine species. It tells you something is there, but not what it is.
Satellite systems used in MPA monitoring
Cost is the other barrier. Open-access data from the Copernicus (Sentinel) and Landsat programs is free but often lacks the resolution or revisit frequency needed for enforcement. Commercial high-resolution imagery ranges from $13 to $30 per km² for archived images to $40 or more per km² for new tasking.2 For an MPA spanning thousands of square kilometers, even a single commercial image can cost tens of thousands of dollars.
AIS and VMS: tracking vessels electronically
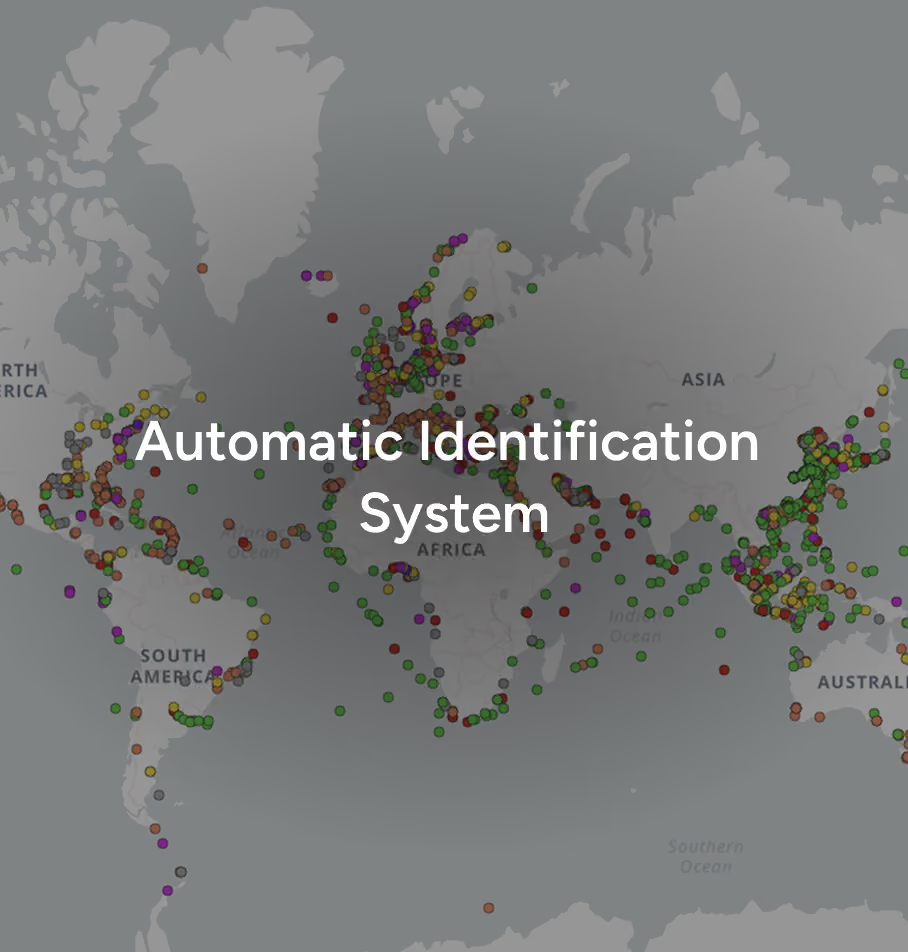
AIS is the world's most widely used vessel tracking tool, broadcasting a ship's position, speed, and heading via VHF radio. Its greatest strength is accessibility: the data is public and available through platforms like Global Fishing Watch.
It is mandated for vessels of 300 GT and above on international voyages, cargo ships of 500 GT and above not engaged on international voyages, and all passenger ships regardless of size,3 leaving the vast majority of the global fishing fleet (vessels under 15 meters) invisible. Captains engaging in illegal activity frequently disable transponders when entering protected waters. Analysis of over 3.7 billion AIS messages from fishing vessels found that disabled transponders obscure up to 6% of global fishing vessel activity, with disabling concentrated near contested EEZ boundaries and transshipment hotspots.4
The dark fleet across 1,380 MPAs
A 2025 study in Science analyzed 1,380 fully and highly protected MPAs worldwide using Global Fishing Watch's AI algorithms paired with Sentinel-1 SAR data. The finding: AIS tracking data missed nearly 90% of vessels detected by radar across these protected areas.5 The “dark fleet” of unreported vessels was largely invisible to conventional monitoring. By fusing satellite radar with transponder data, the study found that while little-to-no industrial fishing occurs in these areas, the vast majority of vessel activity goes undetected by AIS alone.
VMS is a closed, government-operated system that transmits encrypted position data via satellite. It includes tamper-resistant hardware with power-loss alarms.
VMS typically pings only once per hour. In that gap, a fast vessel can enter an MPA, deploy gear, and leave, its track suggesting it merely skirted the boundary. VMS data is also rarely shared between nations, creating blind spots for foreign-flagged vessels.
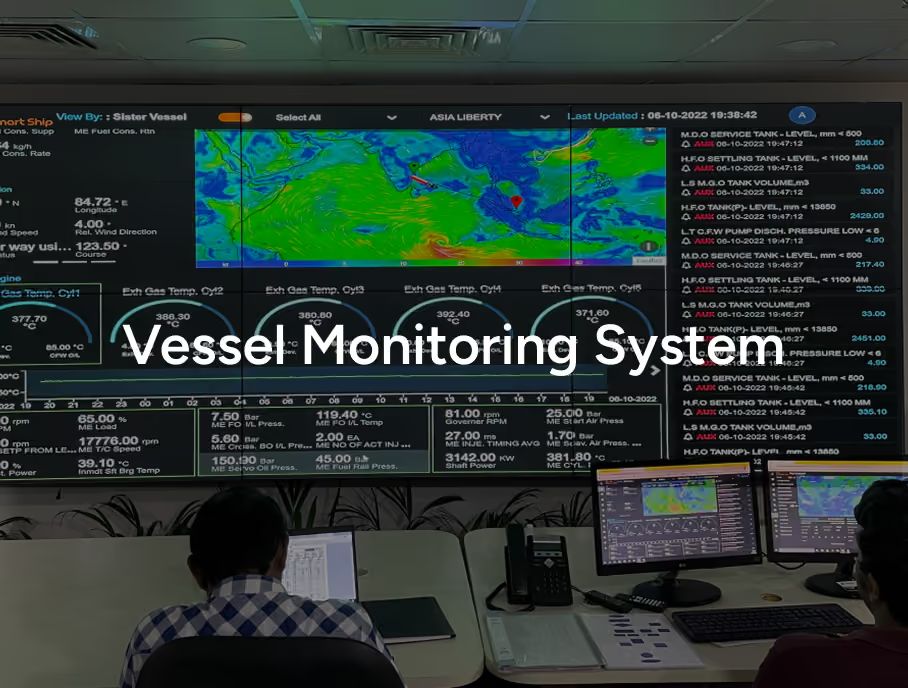
AIS vs. VMS: two tracking systems, different trade-offs
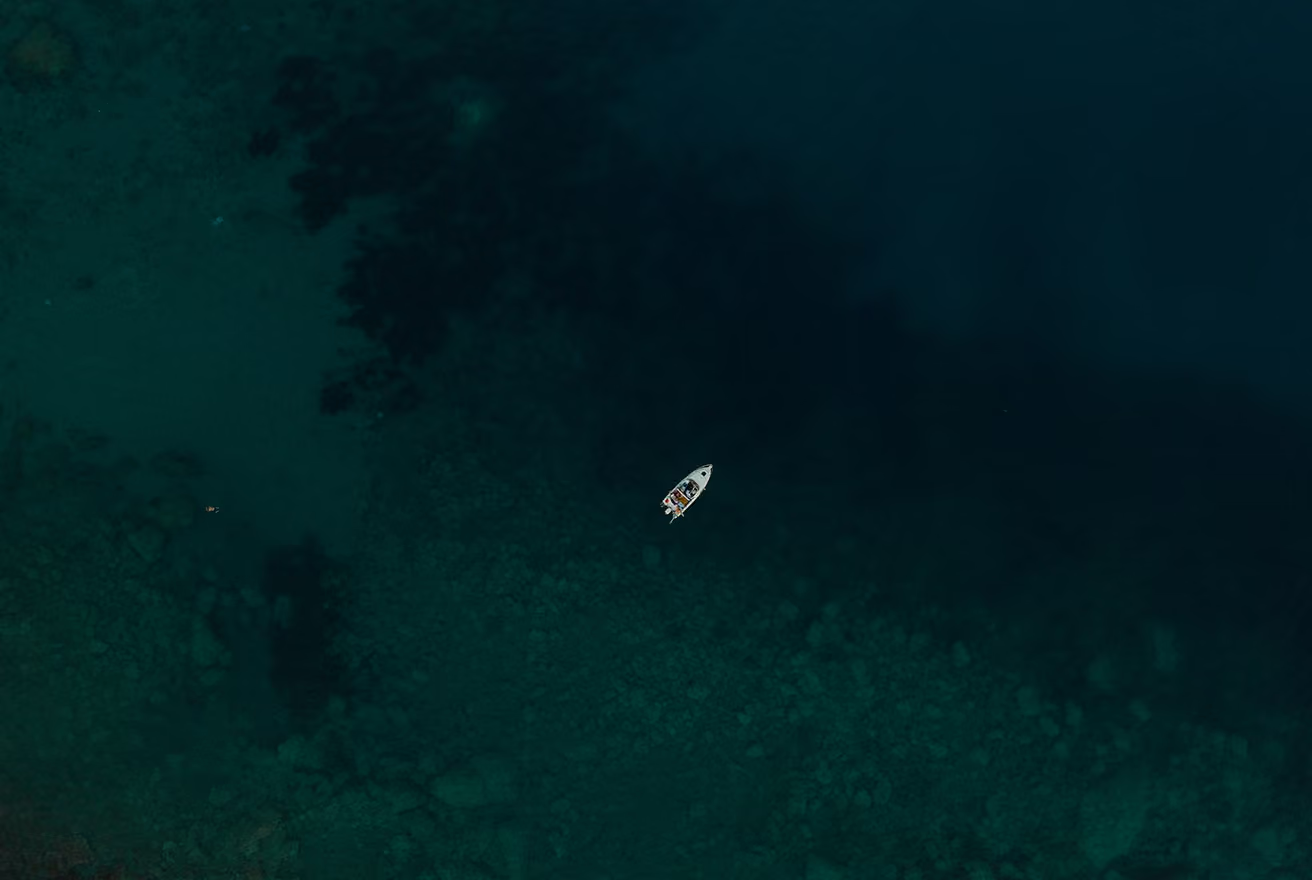
of vessels in fully and highly protected MPAs worldwide were missed by AIS tracking data alone. Satellite radar (SAR) revealed a global 'dark fleet' invisible to conventional monitoring.
Aerial surveillance: aircraft and drones
Aerial platforms provide direct visual evidence that remote sensors cannot match. But the economics are stark. Operating a large maritime patrol aircraft costs nearly $30,000 per hour.6 Even smaller helicopters cost thousands per hour once fuel, pilot training, and maintenance are factored in.
Commercial drones have emerged as a more accessible alternative, with equipment-only operating costs as low as $20 per hour.7 They can loiter for extended periods and launch within minutes of a radar detection. But small drones are grounded by high winds or rain (conditions poachers often exploit), regulatory rules typically require line-of-sight operation, and there are growing concerns about their acoustic impact on marine mammals. (The $20 figure comes from a U.S. traffic incident management pilot program; maritime drones with longer range and specialized sensors typically cost significantly more.)
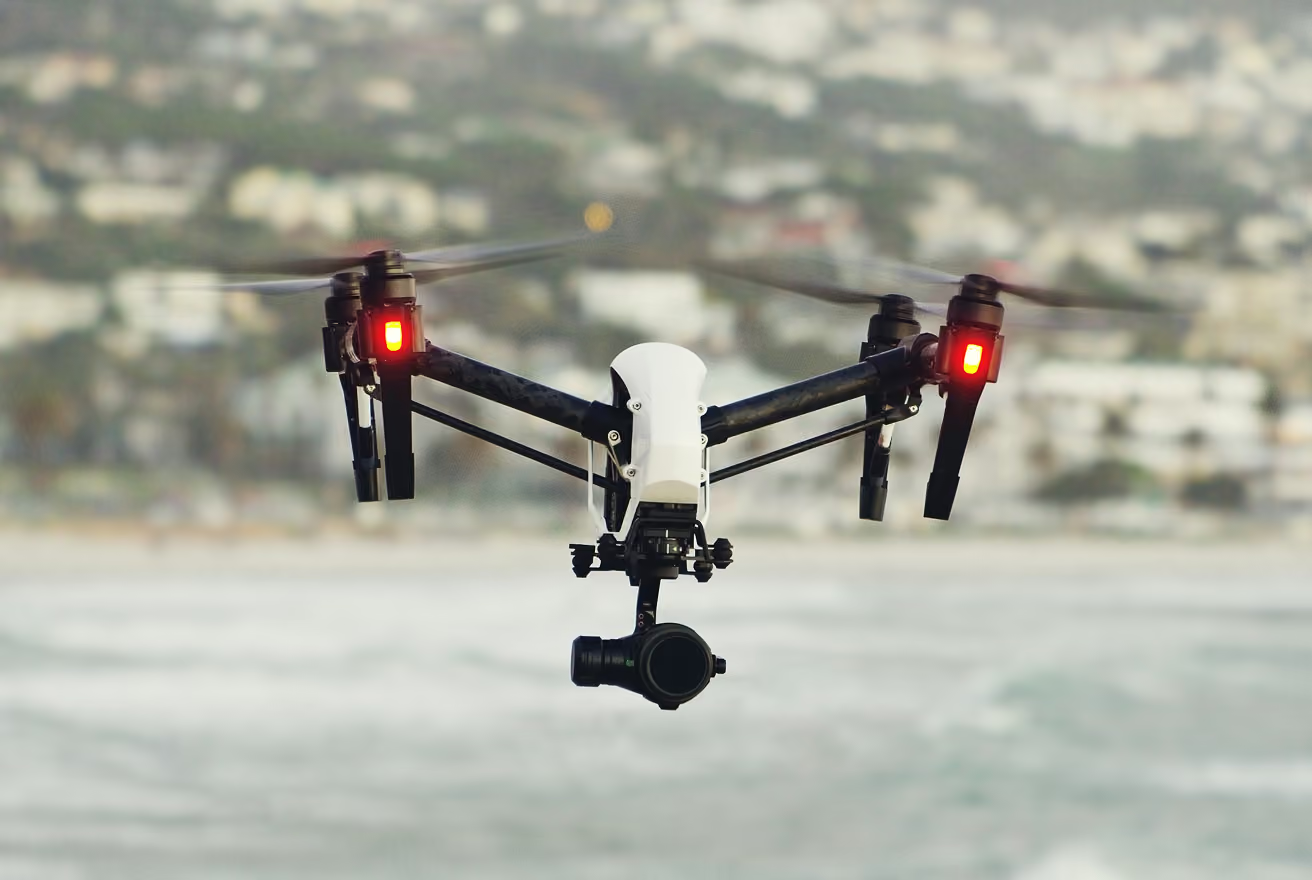
per hour: the cost gap between a small drone patrol and a manned maritime surveillance aircraft. Drones are far cheaper, but weather and regulatory constraints limit their reach.
In situ sensing
Ecosystem-based management requires understanding what is happening beneath the surface: temperature shifts, dissolved oxygen levels, species presence, acoustic environments. In-situ sensors provide the resolution needed to track these indicators. But they bring a different set of constraints, primarily around data retrieval and maintenance in one of the most corrosive environments on Earth.
Temperature and water quality loggers
Autonomous loggers like HOBO and YSI instruments are ubiquitous in marine monitoring. They are precise, affordable, and can run for years on internal batteries. The units are typically mounted on moorings or hidden in seafloor crevices to avoid theft or damage.
The defining limitation is what practitioners call the “manual retrieval trap.” Most loggers require a diver or boat crew to physically collect the unit or connect a data shuttle to download records. This creates a reactive management posture. If a sensor fails from a leaking O-ring, or gets buried by storm-shifted sediment, the failure may not be discovered for months, resulting in an unrecoverable data gap. Biofouling — the accumulation of barnacles, algae, and tubeworms — compounds these challenges further, and can significantly degrade sensor accuracy within weeks to months of deployment.8
The Lough Hyne hypoxia event
Between 2014 and 2019, dissolved oxygen loggers in the Lough Hyne marine reserve revealed that deep habitats were frequently hypoxic (below 2 mg/L), while daytime surface levels were hyperoxic.9 The data was scientifically significant, but the reliance on manual retrieval meant managers were unaware of the severity as events unfolded. The months-long lag between collection and analysis is what researchers have called “data archaeology”: discovering what happened long after the window to respond has closed.
Passive acoustic monitoring
Passive Acoustic Monitoring (PAM) deploys hydrophones to listen to the ocean around the clock, tracking whales, dolphins, soniferous fish, and anthropogenic noise. Unlike visual surveys, PAM is unaffected by visibility, turbidity, or animal behavior. It captures what divers and cameras cannot.
The challenge is volume. A single hydrophone sampling at 96 kHz generates gigabytes of data per day.10 Unless the system is cabled or telemetered, terabytes of recordings must be physically transported from the seafloor to the lab on hard drives. And then the analysis bottleneck begins: thousands of hours of audio need processing. While AI classifiers have been developed to detect endangered species like the North Atlantic Right Whale, they often struggle with high ambient noise from shipping or construction, requiring extensive human validation.
Moored buoys and real-time platforms
Real-time data transmission from moored buoys is the gold standard for operational awareness. These platforms can send sensor readings via satellite or cellular networks directly to a manager's dashboard. The problem is cost.
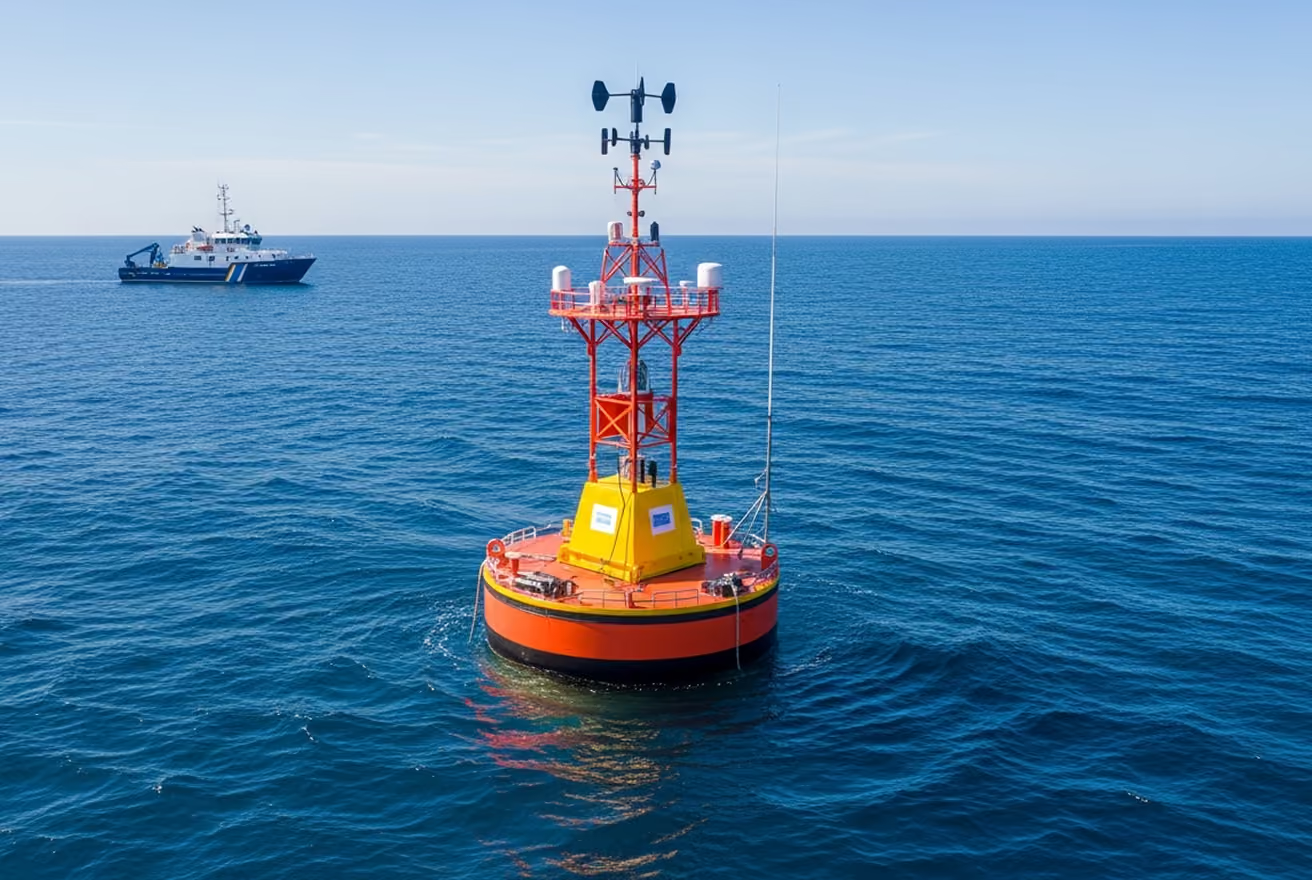
is the typical capital cost of a single research-grade moored buoy system. Annual maintenance adds 15-20% to the initial investment, and biofouling can significantly degrade sensor accuracy within weeks to months of deployment.
Maintenance is not merely electronic. Biofouling, the accumulation of barnacles, algae, and tubeworms, is relentless. In remote MPAs, the lack of specialized service vessels means buoys can remain out of calibration for extended periods, quietly producing unreliable data.
Diver surveys and visual census
Traditional visual census remains the most flexible and taxonomically precise monitoring method. Expert divers can identify juvenile stages, cryptic species, and complex behaviors that cameras miss. But the spatial and temporal limitations are severe.
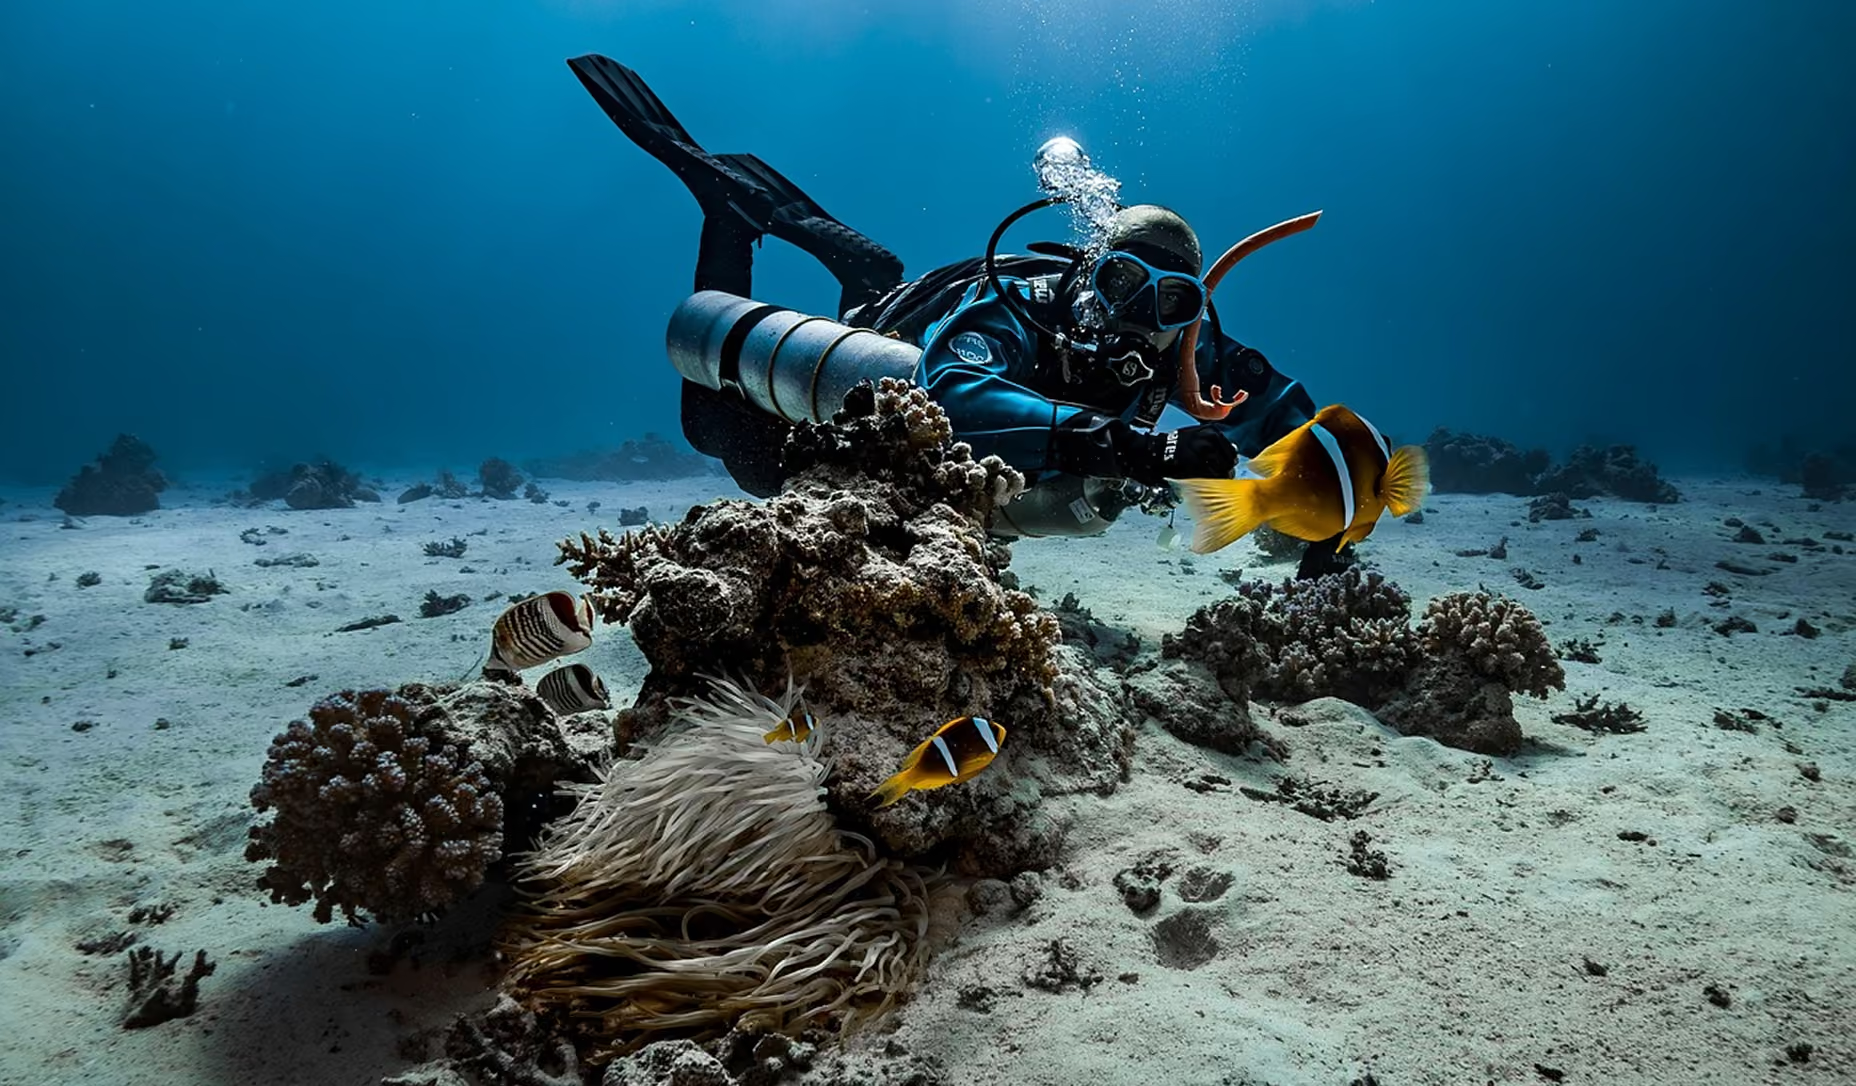
Even well-resourced MPAs typically conduct ecological surveys only one to two times per year, while many sites are monitored far less frequently. With over 40% of protected areas globally showing major deficiencies in management effectiveness, the temporal gaps in monitoring data remain a fundamental barrier to adaptive management.11
Emerging tools: eDNA and camera systems
Environmental DNA (eDNA) metabarcoding isolates genetic traces from water samples and, when combined with conventional visual methods, can yield over 30% more taxonomic richness than either approach alone.12 It is operationally ready for invasive species early warning and rapid biodiversity baselines. But eDNA cannot yet provide reliable data on population age structure, sex ratios, or the absolute biomass figures needed for fisheries quotas. In many tropical MPAs, the lack of localized genetic reference libraries means up to half of the DNA detected cannot be assigned to a specific species.13
Baited Remote Underwater Video (BRUVs) has become a standard tool for monitoring top predators and community structure, recording 40% higher species richness counts than diver-operated video transects.14 But the “bait plume problem” means the true sampling area is unknown, and fixed cameras generate enormous data volumes that require AI-driven analysis to be practical.
In-water and field monitoring: cost and constraints at a glance
Fragmented data, fragmented decisions
The most significant barrier to effective MPA management is not a lack of technology. It is the fragmentation of information. A typical manager oversees a patchwork of disconnected systems: satellite portals for vessel tracking, separate spreadsheets for dive surveys, lab reports for water quality, and proprietary VMS feeds that don't interoperate.
The U.S. Coast Guard's own 2024 C2 Modernization Brief describes its surveillance infrastructure as “bifurcated, disconnected, and stove-piped.”15 The pattern is global: maritime agencies routinely operate multiple monitoring systems that cannot share data in real time. Maritime monitoring fusion centers face significant data latency challenges from incompatible systems, classification barriers, and periodic (rather than continuous) sensor reporting, leaving decision-makers perpetually seeing where a ship was, not where it is.
The consequences extend beyond enforcement. A study of 646 global MPA management plans found that 36% lacked any mention of “cumulative effects,”16 largely because the data on different stressors lived in separate agencies and formats. In the EU, publicly available regulatory data for most maritime activities covered 40% or less of total MPA area.17

Satellite imagery: optical vs. radar
Vendor lock-in and proprietary formats
Many VMS and buoy sensors use closed data formats that prevent managers from easily importing data into a central GIS or dashboard.
Mismatched scales
Integrating a global satellite dataset (kilometer-scale) with a local reef survey (meter-scale) requires advanced geospatial expertise that many MPA teams lack.
Institutional silos
Data is often collected by academic researchers or NGOs independently of the managing agency, producing monitoring that is not tailored to management questions.
Temporal mismatch
AIS updates in real time, satellites in hours, diver surveys in months, and eDNA reference libraries over years. Bringing these datasets together remains a major operational challenge.
Efforts toward integration
Several initiatives are making progress. ERDDAP simplifies data access by allowing users to download data from multiple sources through a single interface. OBIS (Ocean Biodiversity Information System) now hosts more than 150 million species observations.18 Global Fishing Watch's Marine Manager portal integrates vessel tracking, environmental data, and oceanographic layers into a single dashboard designed specifically for MPA managers.
These tools represent real progress, but they address fragments of the problem. A manager still cannot, from a single platform, see vessel activity alongside real-time water quality, acoustic detections, and long-term biodiversity trends. The aspiration of a unified “operational picture” remains largely out of reach for the average MPA.
The measure of an MPA's success in 2030 will not be the hectares inscribed on a map, but the granularity of its awareness. Closing the information gap requires shifting from a culture of collecting data to a culture of generating insight.
1. Wilson, A.M. & Jetz, W. (2016). Remotely sensed high-resolution global cloud dynamics for predicting ecosystem and biodiversity distributions. PLOS Biology, 14(3), e1002415. DOI: 10.1371/journal.pbio.1002415
2. OnGeo Intelligence (2025). Satellite Image Cost & Pricing Guide 2025.
3. International Maritime Organization. (2002). International Convention for the Safety of Life at Sea (SOLAS), 1974, as amended, Chapter V, Regulation 19.2.4. Resolution MSC.99(73), adopted December 12, 2000; amended by Resolution CONF.5/32, December 13, 2002.
4. Welch, H., Clavelle, T., White, T.D., Cimino, M.A., Van Osdel, J., Hochberg, T., Kroodsma, D., & Hazen, E.L. (2022). Hot spots of unseen fishing vessels. Science Advances, 8(44), eabq2109. DOI: 10.1126/sciadv.abq2109
5. Raynor, J., Orofino, S., Costello, C., McDonald, G., Mayorga, J., & Sala, E. (2025). Little-to-no industrial fishing occurs in fully and highly protected marine areas. Science, 389(6758), 392-395. DOI: 10.1126/science.adq3516
6. Congressional Budget Office. (2021). Usage Patterns and Costs of Unmanned Aerial Systems. Publication 57090. Washington, DC: CBO. P-8 Poseidon recurring cost per flying hour: ~$29,900 (2020 dollars).
7. U.S. Department of Transportation, Federal Highway Administration. (2020). Unmanned Aircraft Systems for Traffic Incident Management. Report FHWA-HOP-20-063. Washington State Patrol documented $20/hour equipment-only UAS operational cost during 2018 pilot program. Note: this figure is from a traffic incident management context, not maritime surveillance.
8. Delauney, L., Compère, C., & Lehaitre, M. (2010). Biofouling protection for marine environmental sensors. Ocean Science, 6, 503-511. DOI: 10.5194/os-6-503-2010
9. Plowman, C.Q., Trowbridge, C.D., Davenport, J., et al. (2020). Stressed from above and stressed from below: dissolved oxygen fluctuations in Lough Hyne. ICES Journal of Marine Science, 77(6), 2106–2117. DOI: 10.1093/icesjms/fsaa108
10. Gibb, R., Browning, E., Glover-Kapfer, P., & Jones, K.E. (2019). Emerging opportunities and challenges for passive acoustics in ecological assessment and monitoring. Methods in Ecology and Evolution, 10(2), 169-185. DOI: 10.1111/2041-210X.13101
11. Leverington, F., Costa, K.L., Pavese, H., Lisle, A., & Hockings, M. (2010). A global analysis of protected area management effectiveness. Environmental Management, 46(5), 685-698. DOI: 10.1007/s00267-010-9564-5
12. Stat, M., John, J., DiBattista, J.D., Newman, S.J., Bunce, M., & Harvey, E.S. (2019). Combined use of eDNA metabarcoding and video surveillance for the assessment of fish biodiversity. Conservation Biology, 33(1), 196-205. The >30% figure refers to combined eDNA + BRUVs yielding greater generic richness than either method alone. DOI: 10.1111/cobi.13183
13. Goodwin, K.D., Thompson, L.R., Duarte, B., Kahlke, T., Thompson, A.R., Marques, J.C., & Caçador, I. (2022). Observing life in the sea using environmental DNA. Oceanography, 35(2), 62-75. Reports that at times over 50% of ASVs remained unassigned to the targeted taxonomic level. DOI: 10.5670/oceanog.2022.218
14. Watson, D.L., Harvey, E.S., Fitzpatrick, B.M., Langlois, T.J., & Shedrawi, G. (2010). Assessing reef fish assemblage structure: how do different stereo-video techniques compare? Marine Biology, 157(6), 1237-1250. Species richness counts were 40% higher on stereo-BRUV than stereo-DOV. DOI: 10.1007/s00227-010-1404-x
15. U.S. Coast Guard. (2024). C2 Modernization Brief. Sea Air Space Expo, April 2024. CAPT Christian Hernaez. Describes USCG surveillance systems as 'bifurcated, disconnected, and stove-piped.'
16. Murray, C.C., Dunham, A., Rubidge, E., Francis, F.T., Hunter, K.L., & Hannah, L.C. (2025). Safeguarding marine protected areas from cumulative effects: a review of methods, best practices, and applications. Environmental Management, 75(11), 3010-3024. DOI: 10.1007/s00267-025-02146-w
17. Aminian-Biquet, J., Sletten, J., Vincent, T., Pieraccini, M., Queffelec, B., Laznya, A., Vaidanu, N., Claudet, J., Young, J., & Horta e Costa, B. (2025). Major data gaps and recommendations in monitoring regulations of activities in EU marine protected areas. npj Ocean Sustainability, 4, Article 3. DOI: 10.1038/s44183-025-00104-x
18. OBIS. (2026). Ocean Biodiversity Information System. Intergovernmental Oceanographic Commission of UNESCO. Homepage reports 168 million species observations, 204,000 marine species, 7,088 datasets, and 30 million DNA sequences (accessed March 2026).